
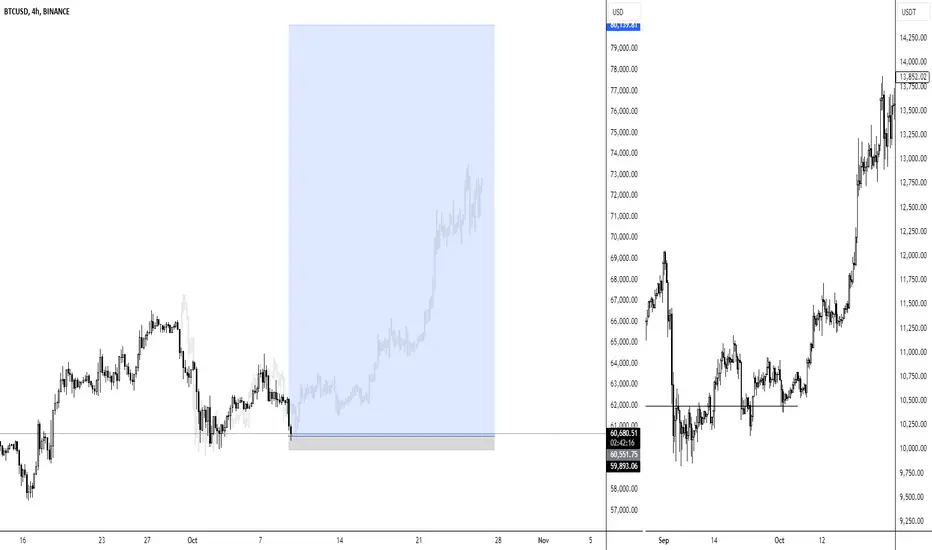
The chart right presents the pre bullmarket btc chart in 2020.
Strategy:
Potential long setup from the consolidation zone. The price action indicates a demand zone around the current levels, with a potential for reversal towards higher levels, as shown in the shaded blue area. The right-hand chart supports this bullish bias.
Entry: Around the current price levels (consolidation)
Stop-loss: Below the local support (recent swing low)
Risk management is essential, considering the current volatility and broader market correlation.
Strategy:
Potential long setup from the consolidation zone. The price action indicates a demand zone around the current levels, with a potential for reversal towards higher levels, as shown in the shaded blue area. The right-hand chart supports this bullish bias.
Entry: Around the current price levels (consolidation)
Stop-loss: Below the local support (recent swing low)
Risk management is essential, considering the current volatility and broader market correlation.
Catatan
Wait for CPI to put a trade on, today. Don't take the trade blindly as it is not active yet.
💎💎- Professional Trader
💎💎 - Discord: discord.gg/gHKNVMyEvd
💎💎 - Trading Course: liquiditysweep369.carrd.co/
💎💎 - Discord: discord.gg/gHKNVMyEvd
💎💎 - Trading Course: liquiditysweep369.carrd.co/
Pernyataan Penyangkalan
Informasi dan publikasi ini tidak dimaksudkan, dan bukan merupakan, saran atau rekomendasi keuangan, investasi, trading, atau jenis lainnya yang diberikan atau didukung oleh TradingView. Baca selengkapnya di Ketentuan Penggunaan.
💎💎- Professional Trader
💎💎 - Discord: discord.gg/gHKNVMyEvd
💎💎 - Trading Course: liquiditysweep369.carrd.co/
💎💎 - Discord: discord.gg/gHKNVMyEvd
💎💎 - Trading Course: liquiditysweep369.carrd.co/
Pernyataan Penyangkalan
Informasi dan publikasi ini tidak dimaksudkan, dan bukan merupakan, saran atau rekomendasi keuangan, investasi, trading, atau jenis lainnya yang diberikan atau didukung oleh TradingView. Baca selengkapnya di Ketentuan Penggunaan.