
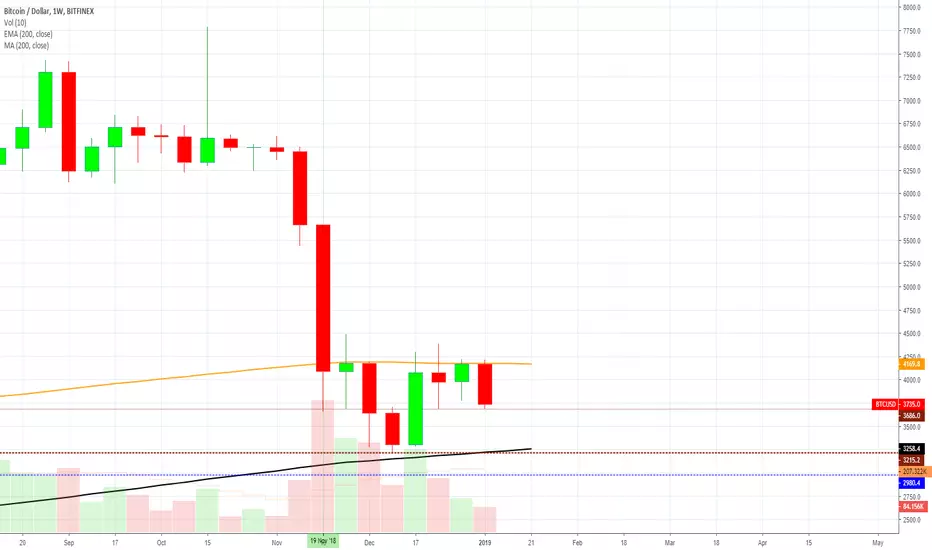
Here is the weekly chart for Bitcoin. Right now it is all about the orange line (EMA200) and black line (MA200)... With these indicators you can have a longer term perspective of what is happening and can also avoid panic: 
Support levels:
Thanks a lot for reading.
Namaste.
- (1) For Bitcoin to continue down/bearish it needs to break and close below the black line.
- (2) For Bitcoin to go bullish it needs to break with good volume and momentum the orange line and close above it.
- (3) This is Bitcoin Made Easy!
Support levels:
Thanks a lot for reading.
Namaste.
Catatan
Thanks a lot for the support, highly appreciated.Catatan
Bitcoin (BTCUSD) Price Action Update (4H Time Frame) + XBT LONG Trade: 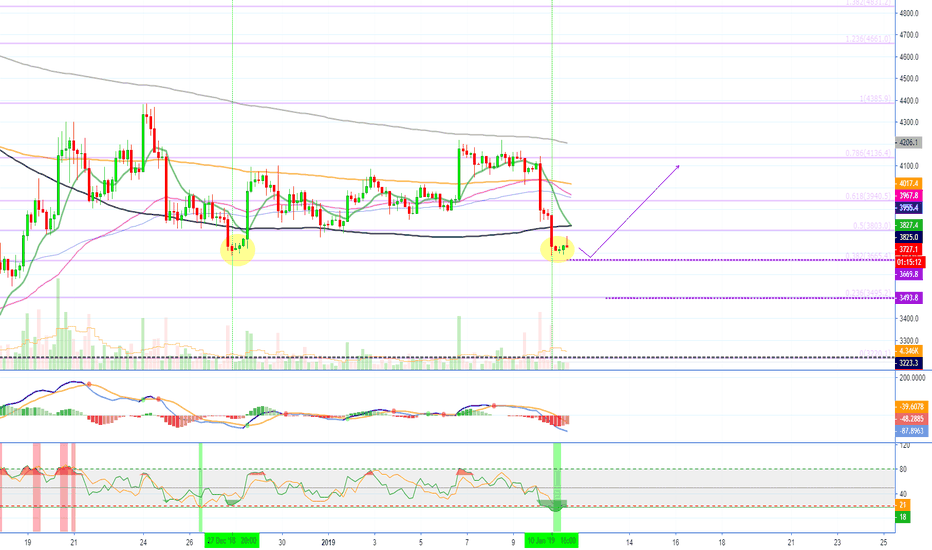
Catatan
MACD bullish crossover on the weekly and histogram turning in favor of the bulls.
Trading Cryptocurrencies can be the hardest undertaking ever without the right trade-numbers, without accurate private-access information. Free is free, but the best always requires sweat, an investment. Since 2017 👇
t.me/masteranandatrades/8778
t.me/masteranandatrades/8778
Publikasi terkait
Pernyataan Penyangkalan
Informasi dan publikasi ini tidak dimaksudkan, dan bukan merupakan, saran atau rekomendasi keuangan, investasi, trading, atau jenis lainnya yang diberikan atau didukung oleh TradingView. Baca selengkapnya di Ketentuan Penggunaan.
Trading Cryptocurrencies can be the hardest undertaking ever without the right trade-numbers, without accurate private-access information. Free is free, but the best always requires sweat, an investment. Since 2017 👇
t.me/masteranandatrades/8778
t.me/masteranandatrades/8778
Publikasi terkait
Pernyataan Penyangkalan
Informasi dan publikasi ini tidak dimaksudkan, dan bukan merupakan, saran atau rekomendasi keuangan, investasi, trading, atau jenis lainnya yang diberikan atau didukung oleh TradingView. Baca selengkapnya di Ketentuan Penggunaan.