
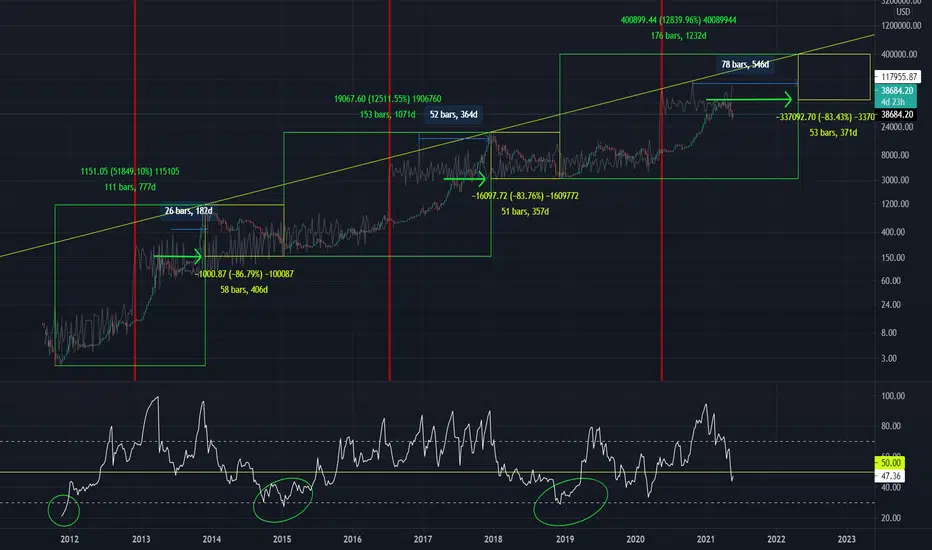
S2F model shows bitcoin is still on track.
Also, we see that this cycle has repeated after each halving (red lines).
At each mid cycle top (there has now been three) we see that it also represents the next cycle low.
Another thing to note are the peaks in the S2F model AFTER each halving; they show where the price will reach BEFORE the Blow-Off-Top
Act Accordingly
Also, we see that this cycle has repeated after each halving (red lines).
At each mid cycle top (there has now been three) we see that it also represents the next cycle low.
Another thing to note are the peaks in the S2F model AFTER each halving; they show where the price will reach BEFORE the Blow-Off-Top
Act Accordingly
Catatan
This guy stole my idea. youtube.com/watch?v=PR6QJV4taJU

Pernyataan Penyangkalan
Informasi dan publikasi ini tidak dimaksudkan, dan bukan merupakan, saran atau rekomendasi keuangan, investasi, trading, atau jenis lainnya yang diberikan atau didukung oleh TradingView. Baca selengkapnya di Ketentuan Penggunaan.
Pernyataan Penyangkalan
Informasi dan publikasi ini tidak dimaksudkan, dan bukan merupakan, saran atau rekomendasi keuangan, investasi, trading, atau jenis lainnya yang diberikan atau didukung oleh TradingView. Baca selengkapnya di Ketentuan Penggunaan.