
⏱️ Reading Time: ~3 minutes
Hey everyone,
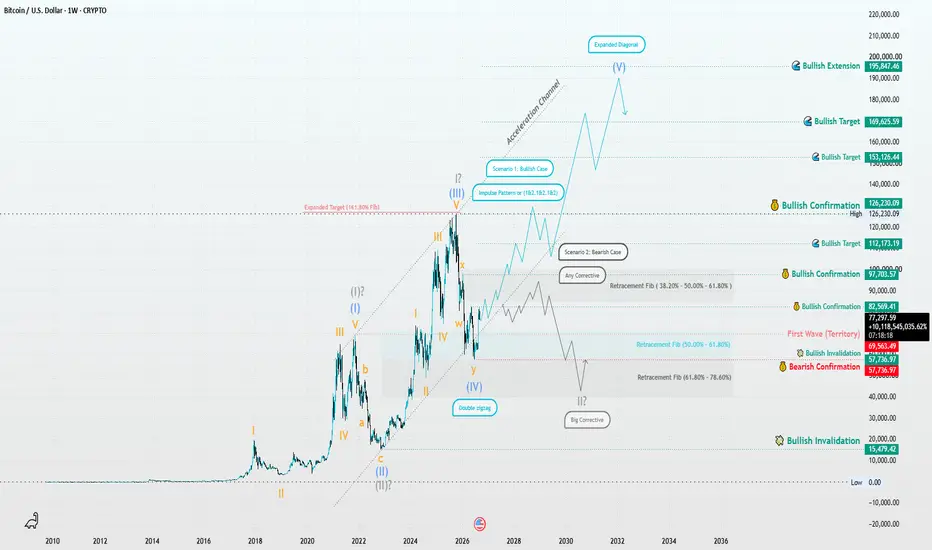
This weekly analysis takes a long-term look at Bitcoin’s structure. At this stage, I think it’s better to keep more than one interpretation open and let the market reveal more of its internal structure before choosing one count with confidence.
🟦 Scenario 1 | Leading Expanding Diagonal
One possible long-term interpretation is that Bitcoin’s entire macro structure could eventually be viewed as a Leading Expanding Diagonal on the linear chart.
If this count is eventually confirmed, the current structure could represent part of the final development of this larger pattern. Once the pattern is complete, a significant higher-degree decline could then become a reasonable expectation.
But there’s an important point here.
Bitcoin is still a relatively young asset compared with traditional markets. So assigning its entire history to one large expanding diagonal and then projecting extremely distant targets, such as $500K–$1M, may simply be too early at this stage.
For me, this remains a structural possibility, not a price prediction.
🟩 Scenario 2 | Nested 1–2 Structures
Another possibility is that, instead of assigning the entire macro structure to one large diagonal, we are looking at two nested 1–2 structures developing across different degrees.
If these motive structures continue to develop, the next higher-degree Wave 3 could eventually produce a powerful expansion.
Under this interpretation, the $500K area becomes a more reasonable long-term structural possibility—without requiring us to define Bitcoin’s entire history as a Leading Expanding Diagonal today.
📐 Linear vs. Logarithmic Scale
Another aspect I find important is comparing the linear and logarithmic charts.
If the major structures, wave relationships, and overall direction of these two scenarios remain consistent across both scales, that can add some confidence to the robustness of the interpretation.
However, the logarithmic scale itself cannot confirm an Elliott Wave count. The real confirmation must come from the internal wave structure, relationships, overlaps, and price behavior as the market develops.
🔎 Final Thought
So, for now:
$500K appears to be a more practical long-term structural possibility under the nested 1–2 scenario.
Meanwhile, $500K–$1M under the Leading Expanding Diagonal scenario remains a much longer-term possibility that needs considerably more structural evidence before we can judge it with confidence.
The market doesn’t need to tell us today which scenario is correct.
The wave structure will reveal that choice along the way.
We follow the structure, not the prediction.
– Patterns whisper. I listen. – Mr. Nobody 🎧📊
Aug 22
Bitcoin: Bullish Structure or Deeper Correction?
Hey everyone,
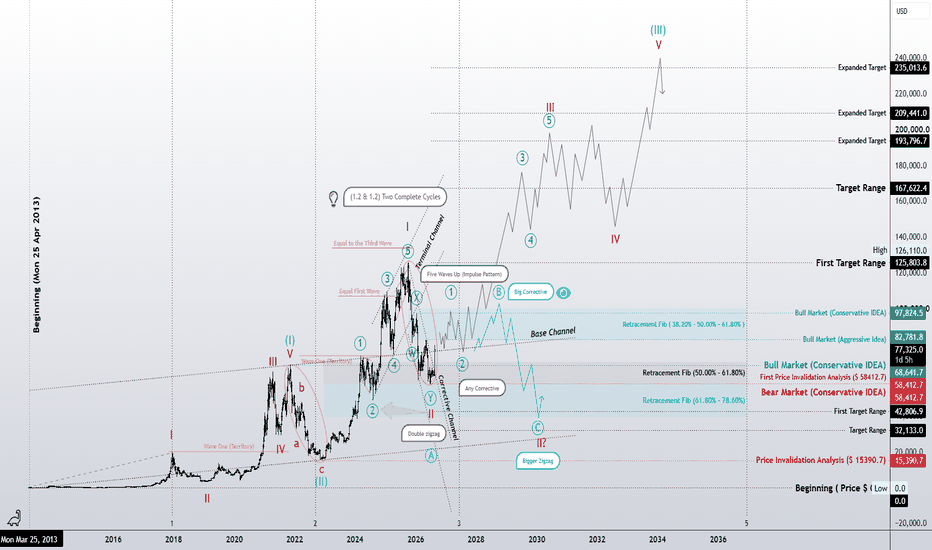
This weekly analysis takes a long-term look at Bitcoin’s structure. At this stage, I think it’s better to keep more than one interpretation open and let the market reveal more of its internal structure before choosing one count with confidence.
🟦 Scenario 1 | Leading Expanding Diagonal
One possible long-term interpretation is that Bitcoin’s entire macro structure could eventually be viewed as a Leading Expanding Diagonal on the linear chart.
If this count is eventually confirmed, the current structure could represent part of the final development of this larger pattern. Once the pattern is complete, a significant higher-degree decline could then become a reasonable expectation.
But there’s an important point here.
Bitcoin is still a relatively young asset compared with traditional markets. So assigning its entire history to one large expanding diagonal and then projecting extremely distant targets, such as $500K–$1M, may simply be too early at this stage.
For me, this remains a structural possibility, not a price prediction.
🟩 Scenario 2 | Nested 1–2 Structures
Another possibility is that, instead of assigning the entire macro structure to one large diagonal, we are looking at two nested 1–2 structures developing across different degrees.
If these motive structures continue to develop, the next higher-degree Wave 3 could eventually produce a powerful expansion.
Under this interpretation, the $500K area becomes a more reasonable long-term structural possibility—without requiring us to define Bitcoin’s entire history as a Leading Expanding Diagonal today.
📐 Linear vs. Logarithmic Scale
Another aspect I find important is comparing the linear and logarithmic charts.
If the major structures, wave relationships, and overall direction of these two scenarios remain consistent across both scales, that can add some confidence to the robustness of the interpretation.
However, the logarithmic scale itself cannot confirm an Elliott Wave count. The real confirmation must come from the internal wave structure, relationships, overlaps, and price behavior as the market develops.
🔎 Final Thought
So, for now:
$500K appears to be a more practical long-term structural possibility under the nested 1–2 scenario.
Meanwhile, $500K–$1M under the Leading Expanding Diagonal scenario remains a much longer-term possibility that needs considerably more structural evidence before we can judge it with confidence.
The market doesn’t need to tell us today which scenario is correct.
The wave structure will reveal that choice along the way.
We follow the structure, not the prediction.
– Patterns whisper. I listen. – Mr. Nobody 🎧📊
Aug 22
Bitcoin: Bullish Structure or Deeper Correction?

Publikasi terkait
Pernyataan Penyangkalan
Informasi dan publikasi ini tidak dimaksudkan, dan bukan merupakan, saran atau rekomendasi keuangan, investasi, trading, atau jenis lainnya yang diberikan atau didukung oleh TradingView. Baca selengkapnya di Ketentuan Penggunaan.
Publikasi terkait
Pernyataan Penyangkalan
Informasi dan publikasi ini tidak dimaksudkan, dan bukan merupakan, saran atau rekomendasi keuangan, investasi, trading, atau jenis lainnya yang diberikan atau didukung oleh TradingView. Baca selengkapnya di Ketentuan Penggunaan.