
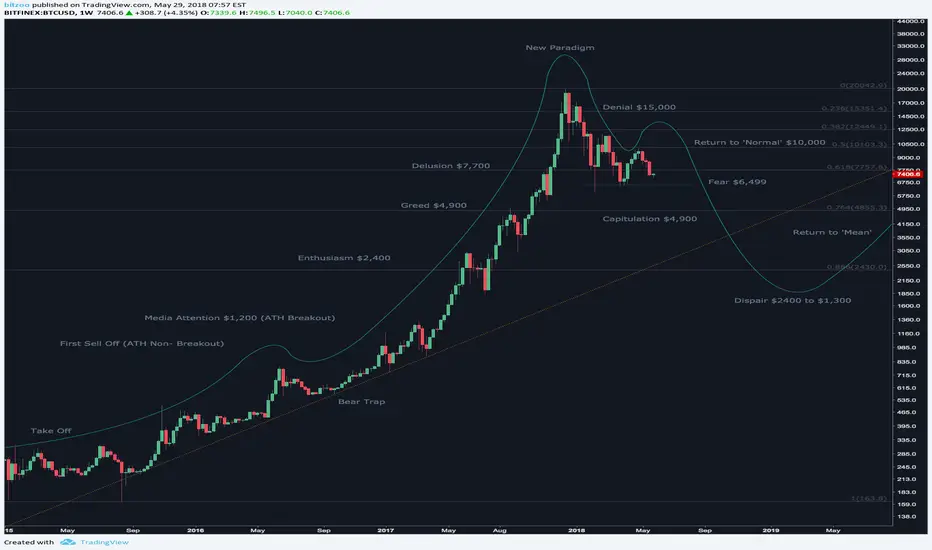
This chart is just for fun. Unless you are a Bull of course.
I have applied the stages of a bubble from here: transportgeography.org/?page_id=9035 - This is a worst case scenario for BTC.
I used fibs from the bottom at $162 to the top of the bull run at $19,900 to work out rough prices for the stages.
I have applied the stages of a bubble from here: transportgeography.org/?page_id=9035 - This is a worst case scenario for BTC.
I used fibs from the bottom at $162 to the top of the bull run at $19,900 to work out rough prices for the stages.

Publikasi terkait
Pernyataan Penyangkalan
Informasi dan publikasi ini tidak dimaksudkan, dan bukan merupakan, saran atau rekomendasi keuangan, investasi, trading, atau jenis lainnya yang diberikan atau didukung oleh TradingView. Baca selengkapnya di Ketentuan Penggunaan.
Publikasi terkait
Pernyataan Penyangkalan
Informasi dan publikasi ini tidak dimaksudkan, dan bukan merupakan, saran atau rekomendasi keuangan, investasi, trading, atau jenis lainnya yang diberikan atau didukung oleh TradingView. Baca selengkapnya di Ketentuan Penggunaan.