
1. Market Overview
The US–Iran ceasefire agreement is impacting BTC as the market becomes more open to risk assets such as cryptocurrencies. This has created a positive sentiment and provided support for Bitcoin’s bullish momentum.
2. Technical Analysis
a. Structure & Trend
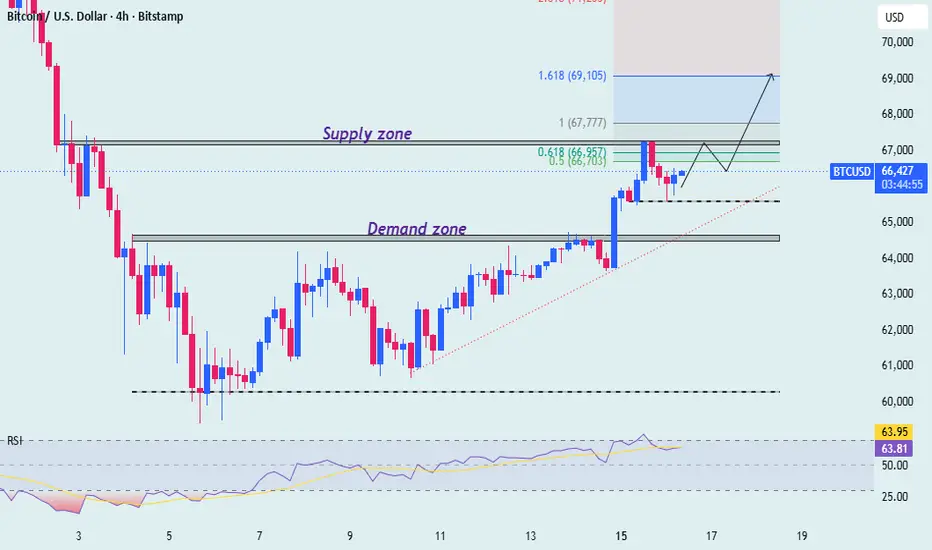
The previous strong resistance zone around 64,500 has been broken, indicating that the bearish structure has weakened.
The current structure suggests that the short-term bullish trend remains intact, with clear Higher Lows and Higher Highs forming.
The ascending trendline continues to hold, showing that buyers are still in control of the market.
b. Key Support & Resistance Zones
📊 Strong Support Zone: 64,500 – 64,800
This was a previous key resistance area and has now turned into support. Buyers are expected to defend this zone to maintain the bullish structure.
📊 Strong Resistance Zone: 67,200 – 67,500
This is a strong supply area where price previously reacted and selling pressure appeared.
BTC needs a clear H4 candle close above this zone to confirm further bullish continuation.
3. Outlook
BTC is currently showing a slight pullback after reaching a liquidity zone and entering an overbought condition. However, improving geopolitical sentiment is creating favorable conditions for Bitcoin to continue its upward movement in the near future.
Wish you a successful trading day
The US–Iran ceasefire agreement is impacting BTC as the market becomes more open to risk assets such as cryptocurrencies. This has created a positive sentiment and provided support for Bitcoin’s bullish momentum.
2. Technical Analysis
a. Structure & Trend
The previous strong resistance zone around 64,500 has been broken, indicating that the bearish structure has weakened.
The current structure suggests that the short-term bullish trend remains intact, with clear Higher Lows and Higher Highs forming.
The ascending trendline continues to hold, showing that buyers are still in control of the market.
b. Key Support & Resistance Zones
📊 Strong Support Zone: 64,500 – 64,800
This was a previous key resistance area and has now turned into support. Buyers are expected to defend this zone to maintain the bullish structure.
📊 Strong Resistance Zone: 67,200 – 67,500
This is a strong supply area where price previously reacted and selling pressure appeared.
BTC needs a clear H4 candle close above this zone to confirm further bullish continuation.
3. Outlook
BTC is currently showing a slight pullback after reaching a liquidity zone and entering an overbought condition. However, improving geopolitical sentiment is creating favorable conditions for Bitcoin to continue its upward movement in the near future.
Wish you a successful trading day

Publikasi terkait
Pernyataan Penyangkalan
Informasi dan publikasi ini tidak dimaksudkan, dan bukan merupakan, saran atau rekomendasi keuangan, investasi, trading, atau jenis lainnya yang diberikan atau didukung oleh TradingView. Baca selengkapnya di Ketentuan Penggunaan.
Publikasi terkait
Pernyataan Penyangkalan
Informasi dan publikasi ini tidak dimaksudkan, dan bukan merupakan, saran atau rekomendasi keuangan, investasi, trading, atau jenis lainnya yang diberikan atau didukung oleh TradingView. Baca selengkapnya di Ketentuan Penggunaan.