
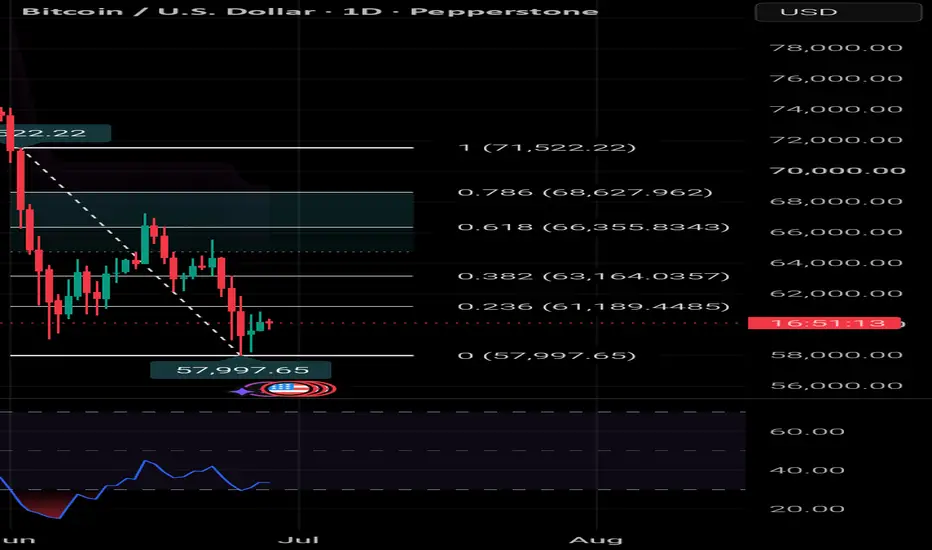
Bitcoin is currently trading around the 0.236 Fibonacci level ($61.2K) after bouncing from a strong support near $58K (0 Fib). This area has acted as a key demand zone, where buyers stepped in to defend the recent sell-off.
Bullish Scenario 📈
Holding above $58K keeps the short-term recovery intact.
A successful breakout above $61.2K (0.236 Fib) could open the path toward:
$63.2K (0.382 Fib)
$66.3K (0.618 Fib)
$68.6K (0.786 Fib)
Momentum is still weak, but the RSI is recovering from oversold territory, suggesting that bullish pressure is gradually returning.
Bearish Scenario 📉
Failure to reclaim the 0.236 Fib resistance may trigger another rejection.
A break below $58K would invalidate the current rebound and could lead to a deeper correction, potentially creating new swing lows.
Key Levels
🟢 Support: $58,000 🔴 Resistance: $61,190 | $63,164 | $66,356 | $68,628
Conclusion: BTC is attempting to build a base after a sharp decline. The market remains in a corrective structure until price can reclaim higher Fibonacci levels. Traders should watch for confirmation before anticipating a sustained trend reversal.
This is my personal technical analysis and not financial advice. Always manage your risk.
#BTC #Bitcoin #BTCUSD #Crypto #TechnicalAnalysis #TradingView #PriceAction #Fibonacci #SupportAndResistance #RiskManagement
Bullish Scenario 📈
Holding above $58K keeps the short-term recovery intact.
A successful breakout above $61.2K (0.236 Fib) could open the path toward:
$63.2K (0.382 Fib)
$66.3K (0.618 Fib)
$68.6K (0.786 Fib)
Momentum is still weak, but the RSI is recovering from oversold territory, suggesting that bullish pressure is gradually returning.
Bearish Scenario 📉
Failure to reclaim the 0.236 Fib resistance may trigger another rejection.
A break below $58K would invalidate the current rebound and could lead to a deeper correction, potentially creating new swing lows.
Key Levels
🟢 Support: $58,000 🔴 Resistance: $61,190 | $63,164 | $66,356 | $68,628
Conclusion: BTC is attempting to build a base after a sharp decline. The market remains in a corrective structure until price can reclaim higher Fibonacci levels. Traders should watch for confirmation before anticipating a sustained trend reversal.
This is my personal technical analysis and not financial advice. Always manage your risk.
#BTC #Bitcoin #BTCUSD #Crypto #TechnicalAnalysis #TradingView #PriceAction #Fibonacci #SupportAndResistance #RiskManagement

Pernyataan Penyangkalan
Informasi dan publikasi ini tidak dimaksudkan, dan bukan merupakan, saran atau rekomendasi keuangan, investasi, trading, atau jenis lainnya yang diberikan atau didukung oleh TradingView. Baca selengkapnya di Ketentuan Penggunaan.
Pernyataan Penyangkalan
Informasi dan publikasi ini tidak dimaksudkan, dan bukan merupakan, saran atau rekomendasi keuangan, investasi, trading, atau jenis lainnya yang diberikan atau didukung oleh TradingView. Baca selengkapnya di Ketentuan Penggunaan.