
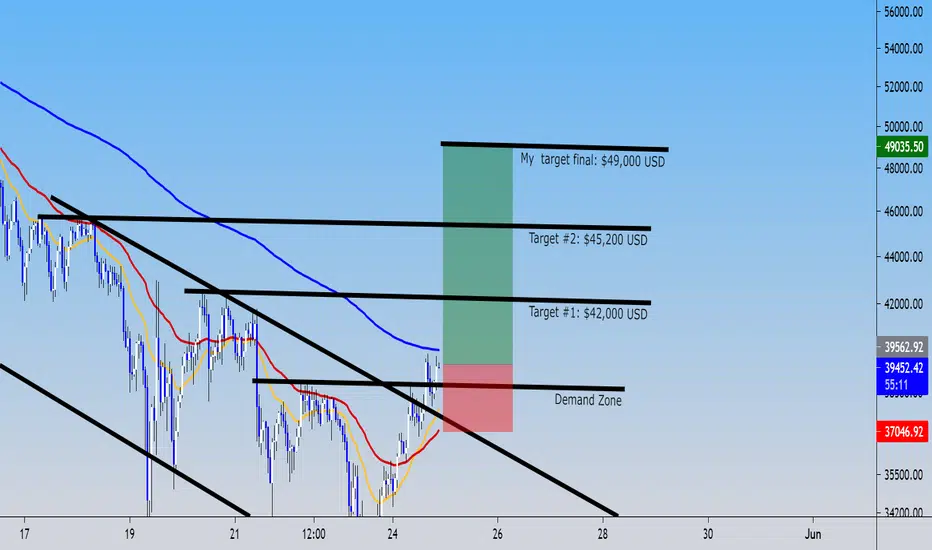
In this chart, we see that Bitcoin broke up this bullish flag; reversal pattern. So, that mean that Bitcoin have al chances to continue up in this week to $49,000 USD, my target profit.
s3.tradingview.com/snapshots/g/gm1zyMmH.png
This it's the H4 timeframe and the chartist pattern that I said: the bullish flag!!!
So guys, in my other analysis of bear market, will be closed up inmediately as Bitcoin continue up and get some profit of the short position, then, you can to entry right now in H1 timeframe and put the SL at $37,000 USD and consider these targets to reach in this up in this beautiful trade.
Good luck!!!
s3.tradingview.com/snapshots/g/gm1zyMmH.png
This it's the H4 timeframe and the chartist pattern that I said: the bullish flag!!!
So guys, in my other analysis of bear market, will be closed up inmediately as Bitcoin continue up and get some profit of the short position, then, you can to entry right now in H1 timeframe and put the SL at $37,000 USD and consider these targets to reach in this up in this beautiful trade.
Good luck!!!
Trading ditutup: stop tercapai
Bitcoin touch our SL, but it´s still bullish, but we see that form a shoulder head shoulder.
Pernyataan Penyangkalan
Informasi dan publikasi ini tidak dimaksudkan, dan bukan merupakan, saran atau rekomendasi keuangan, investasi, trading, atau jenis lainnya yang diberikan atau didukung oleh TradingView. Baca selengkapnya di Ketentuan Penggunaan.
Pernyataan Penyangkalan
Informasi dan publikasi ini tidak dimaksudkan, dan bukan merupakan, saran atau rekomendasi keuangan, investasi, trading, atau jenis lainnya yang diberikan atau didukung oleh TradingView. Baca selengkapnya di Ketentuan Penggunaan.