
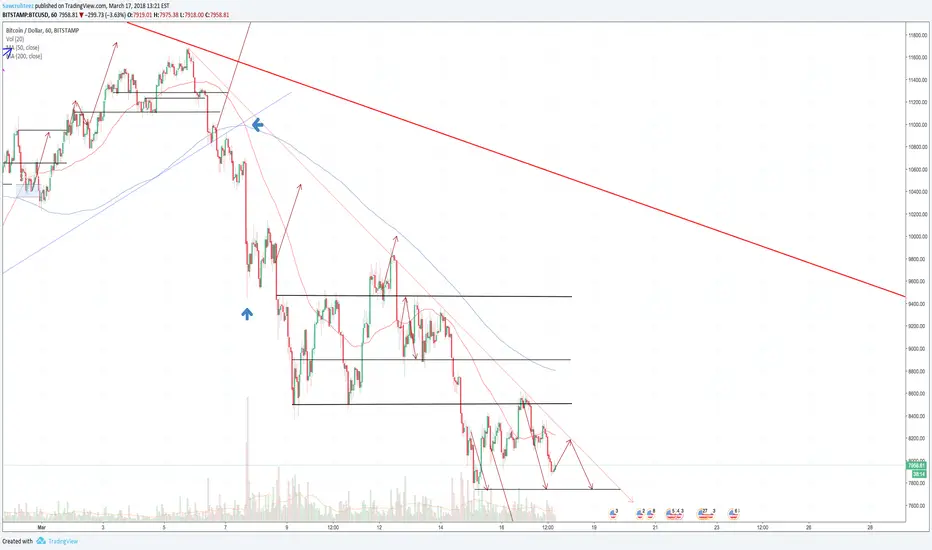
Yesterday I called for a drawdown to $7,750 and I did not expect many buyers to be waiting under $8,000 this time around.
The next area of support that I am watching is $6,750. That would be the fourth touch on the longer term bull trend (green line).
To my surprise we dipped below $8,000 and appear to be building support. The battle this weekend will be between the horizontal support (black) and shorter term trend resistance (red dotted).
Currently the horizontal support appears to be winning. As the price resists the bear trend (red dotted) it continues to support above $7,750. That is causing the price to range in between $7,750 and $8,450. If it keeps moving sideways then it will smash right through the shorter term bear trend (red dotted) and likely make a move to test the longer term bear trend (solid red).
Happy Trading!
The next area of support that I am watching is $6,750. That would be the fourth touch on the longer term bull trend (green line).
To my surprise we dipped below $8,000 and appear to be building support. The battle this weekend will be between the horizontal support (black) and shorter term trend resistance (red dotted).
Currently the horizontal support appears to be winning. As the price resists the bear trend (red dotted) it continues to support above $7,750. That is causing the price to range in between $7,750 and $8,450. If it keeps moving sideways then it will smash right through the shorter term bear trend (red dotted) and likely make a move to test the longer term bear trend (solid red).
Happy Trading!

emasar Indicator is available for purchase at alphanalysis.io/product/emasar/
Pernyataan Penyangkalan
Informasi dan publikasi ini tidak dimaksudkan, dan bukan merupakan, saran atau rekomendasi keuangan, investasi, trading, atau jenis lainnya yang diberikan atau didukung oleh TradingView. Baca selengkapnya di Ketentuan Penggunaan.
emasar Indicator is available for purchase at alphanalysis.io/product/emasar/
Pernyataan Penyangkalan
Informasi dan publikasi ini tidak dimaksudkan, dan bukan merupakan, saran atau rekomendasi keuangan, investasi, trading, atau jenis lainnya yang diberikan atau didukung oleh TradingView. Baca selengkapnya di Ketentuan Penggunaan.