
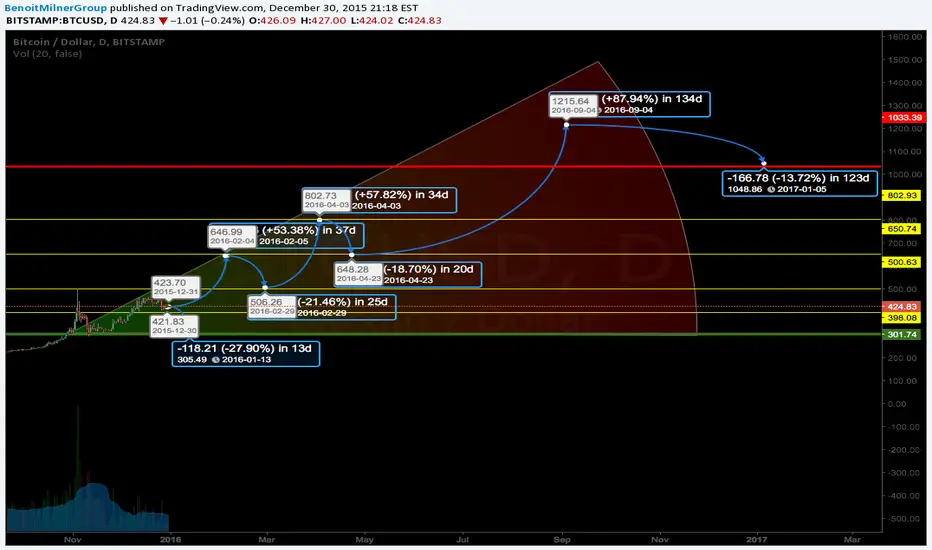
This is our Year Long Structure. If we see a break below $300 during the year the we should expect further selling but
We expect to see a gradual rise back to $1200 during 2016
The yellow lines represent "Key Levels" which could act as a support or a resistance.
The red and green lines represent "Strong Support & Strong Resistance.
But this is another very good guideline for trading BTC in 2016.
Posting some short term BTC ideas for January.
Remember to follow and any questions just comment!
We expect to see a gradual rise back to $1200 during 2016
The yellow lines represent "Key Levels" which could act as a support or a resistance.
The red and green lines represent "Strong Support & Strong Resistance.
But this is another very good guideline for trading BTC in 2016.
Posting some short term BTC ideas for January.
Remember to follow and any questions just comment!

Pernyataan Penyangkalan
Informasi dan publikasi ini tidak dimaksudkan, dan bukan merupakan, saran atau rekomendasi keuangan, investasi, trading, atau jenis lainnya yang diberikan atau didukung oleh TradingView. Baca selengkapnya di Ketentuan Penggunaan.
Pernyataan Penyangkalan
Informasi dan publikasi ini tidak dimaksudkan, dan bukan merupakan, saran atau rekomendasi keuangan, investasi, trading, atau jenis lainnya yang diberikan atau didukung oleh TradingView. Baca selengkapnya di Ketentuan Penggunaan.