
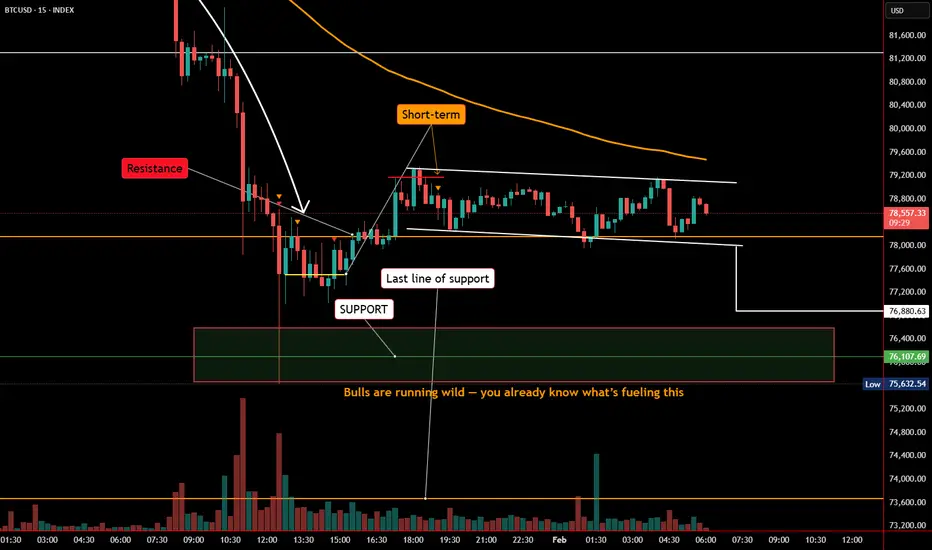
In the last post, BTC was losing momentum with risk toward $76,107.69 and deeper support at $73,672.50 (0.786 Fib) if selling accelerated.
Price found support at the 0.618 Fibonacci retracement, which is the ORANGE horizontal level on the chart. That level held and triggered a bounce, but upside has been capped by descending resistance, keeping BTC in a tightening range.
Current structure:
Bulls defended the 0.618, but continuation requires a clean break above resistance. Until then, price remains in consolidation with expansion approaching.
Bias:
This is a decision zone. Let price confirm.
Not financial advice.
Price found support at the 0.618 Fibonacci retracement, which is the ORANGE horizontal level on the chart. That level held and triggered a bounce, but upside has been capped by descending resistance, keeping BTC in a tightening range.
Current structure:
- ORANGE horizontal support = 0.618 Fib (line in the sand)
- Descending resistance: Limiting upside momentum
- Short-term structure: Lower highs / compression
- Major demand zone: Green box below — next bullish defense if 0.618 fails
- Downside risk: Loss of 0.618 opens the door to the 0.786 Fib
Bulls defended the 0.618, but continuation requires a clean break above resistance. Until then, price remains in consolidation with expansion approaching.
Bias:
- Hold 0.618 (ORANGE) → Bullish continuation attempt
- Lose 0.618 → Pullback toward deeper Fib support
This is a decision zone. Let price confirm.
Not financial advice.

Publikasi terkait
Pernyataan Penyangkalan
Informasi dan publikasi ini tidak dimaksudkan, dan bukan merupakan, saran atau rekomendasi keuangan, investasi, trading, atau jenis lainnya yang diberikan atau didukung oleh TradingView. Baca selengkapnya di Ketentuan Penggunaan.
Publikasi terkait
Pernyataan Penyangkalan
Informasi dan publikasi ini tidak dimaksudkan, dan bukan merupakan, saran atau rekomendasi keuangan, investasi, trading, atau jenis lainnya yang diberikan atau didukung oleh TradingView. Baca selengkapnya di Ketentuan Penggunaan.