
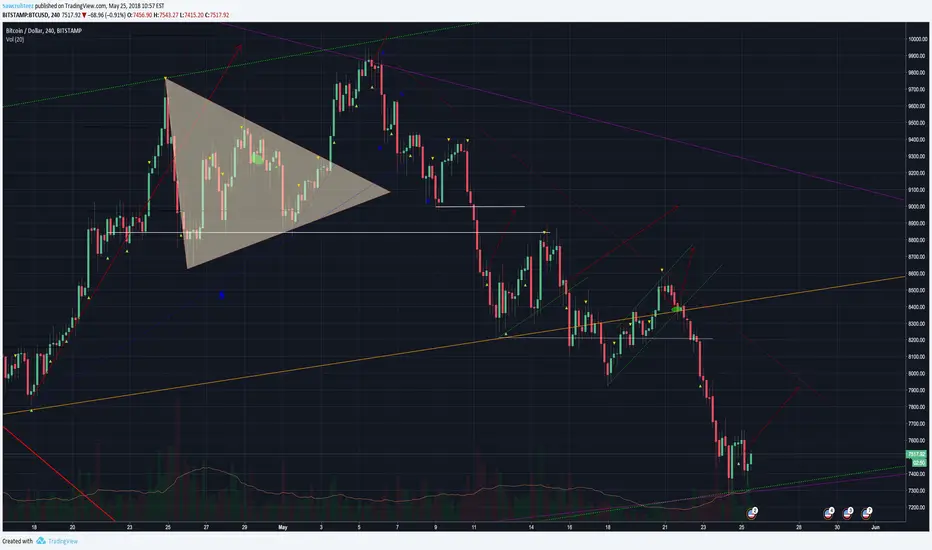
Over the past couple of days we have been dancing on the longer term bull trend line (green dotted). We got a bounce from $7,250 that was short lived. Resistance at $7,650 sent us back down for a retest of the bull trend line.
I do not believe that we are in danger of breaking down through that area of support just yet. We are still in oversold conditions from the pullback on May 22nd and are highly likely to bounce for a retest of the downtrend that started on May 6th (red dotted). The daily chart has not been so far below the 12 & 26 EMA's since April 1st and that points toward a reversion to the mean over the next couple days.
Nevertheless I am remaining on the sidelines until the triangle breaks that started forming Feb 6th. Longing here does provide a very favorable risk:reward, however I have gotten burned too much by being a bull as of late and am content to wait for further confirmation.
Happy trading and go bulls!
A like, comment and follow a day keeps the bears completely away!
I do not believe that we are in danger of breaking down through that area of support just yet. We are still in oversold conditions from the pullback on May 22nd and are highly likely to bounce for a retest of the downtrend that started on May 6th (red dotted). The daily chart has not been so far below the 12 & 26 EMA's since April 1st and that points toward a reversion to the mean over the next couple days.
Nevertheless I am remaining on the sidelines until the triangle breaks that started forming Feb 6th. Longing here does provide a very favorable risk:reward, however I have gotten burned too much by being a bull as of late and am content to wait for further confirmation.
Happy trading and go bulls!
A like, comment and follow a day keeps the bears completely away!

emasar Indicator is available for purchase at alphanalysis.io/product/emasar/
Pernyataan Penyangkalan
Informasi dan publikasi ini tidak dimaksudkan, dan bukan merupakan, saran atau rekomendasi keuangan, investasi, trading, atau jenis lainnya yang diberikan atau didukung oleh TradingView. Baca selengkapnya di Ketentuan Penggunaan.
emasar Indicator is available for purchase at alphanalysis.io/product/emasar/
Pernyataan Penyangkalan
Informasi dan publikasi ini tidak dimaksudkan, dan bukan merupakan, saran atau rekomendasi keuangan, investasi, trading, atau jenis lainnya yang diberikan atau didukung oleh TradingView. Baca selengkapnya di Ketentuan Penggunaan.