
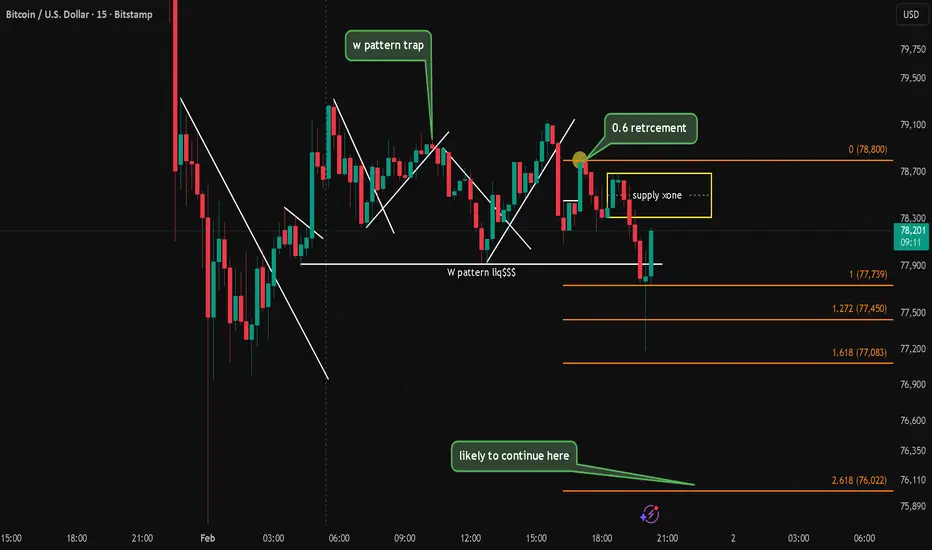
Analysis of the 15m Chart On the lower timeframes (LTF), we have observed a significant sell-off followed by a "W" pattern (Double Bottom) formation. While this typically signals a reversal, context is everything in the current market environment.
The Logic Behind the Setup
It is crucial to remember that bullish patterns occurring within a sustained downtrend often function as liquidity traps. Unless these patterns materialize at a validated High Timeframe (HTF) support or demand zone, they lack the structural significance to reverse the primary trend.
Strategy and Bias
Bearish Bias: Given the prevailing market conditions, our bias remains bearish.
Sell on Rise: We view current pullbacks and LTF bullish structures as "sell on rise" opportunities rather than long entries.
Filter the Noise: By aligning with the HTF trend, we can filter out LTF noise and avoid speculative entries that result in being trapped by minor corrective moves.
I have marked the specific trap mechanics on the chart to illustrate why patience is favored over chasing these localized reversals.
The Logic Behind the Setup
It is crucial to remember that bullish patterns occurring within a sustained downtrend often function as liquidity traps. Unless these patterns materialize at a validated High Timeframe (HTF) support or demand zone, they lack the structural significance to reverse the primary trend.
Strategy and Bias
Bearish Bias: Given the prevailing market conditions, our bias remains bearish.
Sell on Rise: We view current pullbacks and LTF bullish structures as "sell on rise" opportunities rather than long entries.
Filter the Noise: By aligning with the HTF trend, we can filter out LTF noise and avoid speculative entries that result in being trapped by minor corrective moves.
I have marked the specific trap mechanics on the chart to illustrate why patience is favored over chasing these localized reversals.
Trading ditutup: target tercapai
tested our 76022 lvl
Pernyataan Penyangkalan
Informasi dan publikasi ini tidak dimaksudkan, dan bukan merupakan, saran atau rekomendasi keuangan, investasi, trading, atau jenis lainnya yang diberikan atau didukung oleh TradingView. Baca selengkapnya di Ketentuan Penggunaan.
Pernyataan Penyangkalan
Informasi dan publikasi ini tidak dimaksudkan, dan bukan merupakan, saran atau rekomendasi keuangan, investasi, trading, atau jenis lainnya yang diberikan atau didukung oleh TradingView. Baca selengkapnya di Ketentuan Penggunaan.