
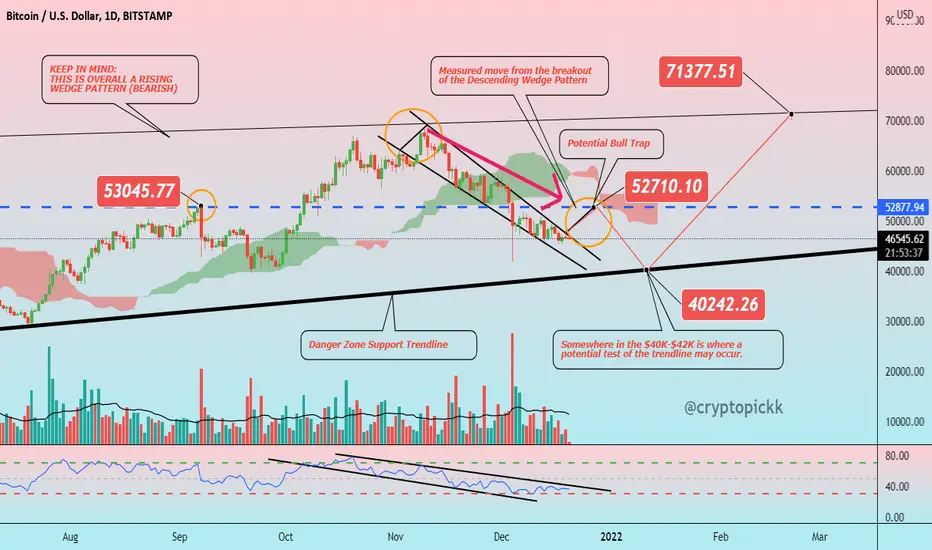
Hello friends, today you can review the technical analysis idea on a 1D linear scale chart for Bitcoin ( BTCUSD ), a cryptocurrency.
The chart is self-explanatory. The overall pattern is a Rising Wedge, but the price may still have potential to get back to the top of the pattern before it has a major drop.
Additionally Shown: Ichimoku Clouds, RSI (relative strength index), Support and Resistance Trendline, and Volume
If you enjoy my ideas, feel free to like it and drop in a comment. I love reading your comments below.
As the year is coming to an end and holidays are almost here. I want to wish my friends Happy Holidays and ready for an exciting 2022! What are your thoughts for the coming year?
Disclosure: This is just my opinion and not any type of financial advice. I enjoy charting and discussing technical analysis . Don't trade based on my advice. Do your own research! #cryptopickk
Catatan
Bull trap exactly as predicted. Keep an eye on the lower levels. We may be headed between $40K-$42K.
Publikasi terkait
Pernyataan Penyangkalan
Informasi dan publikasi ini tidak dimaksudkan, dan bukan merupakan, saran atau rekomendasi keuangan, investasi, trading, atau jenis lainnya yang diberikan atau didukung oleh TradingView. Baca selengkapnya di Ketentuan Penggunaan.
Publikasi terkait
Pernyataan Penyangkalan
Informasi dan publikasi ini tidak dimaksudkan, dan bukan merupakan, saran atau rekomendasi keuangan, investasi, trading, atau jenis lainnya yang diberikan atau didukung oleh TradingView. Baca selengkapnya di Ketentuan Penggunaan.