
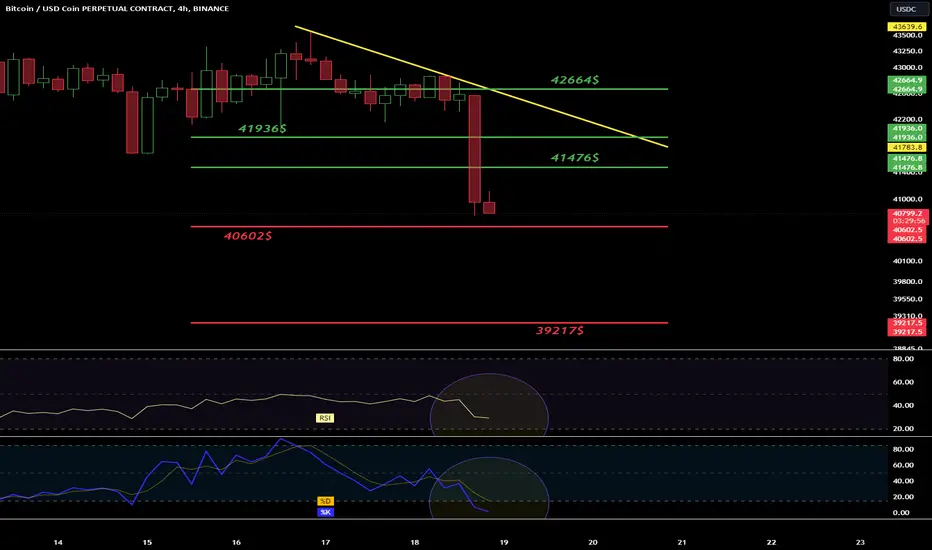
Hello everyone, let's take a look at the BTC to USDT chart on a one hour time frame. As you can see, the price has dropped significantly and remains below the downtrend line.
After unfolding the trend based fib extension grid, you can see support at $40,602, and then strong support at $39,217.
Looking the other way, we have resistance at $41,476, the second at $41,936, and the third strong resistance at $42,664.
The RSI shows room for the price to go lower, while the STOCH indicator is approaching the lower limit, which stopped the price decline.
After unfolding the trend based fib extension grid, you can see support at $40,602, and then strong support at $39,217.
Looking the other way, we have resistance at $41,476, the second at $41,936, and the third strong resistance at $42,664.
The RSI shows room for the price to go lower, while the STOCH indicator is approaching the lower limit, which stopped the price decline.

Pernyataan Penyangkalan
Informasi dan publikasi ini tidak dimaksudkan, dan bukan merupakan, saran atau rekomendasi keuangan, investasi, trading, atau jenis lainnya yang diberikan atau didukung oleh TradingView. Baca selengkapnya di Ketentuan Penggunaan.
Pernyataan Penyangkalan
Informasi dan publikasi ini tidak dimaksudkan, dan bukan merupakan, saran atau rekomendasi keuangan, investasi, trading, atau jenis lainnya yang diberikan atau didukung oleh TradingView. Baca selengkapnya di Ketentuan Penggunaan.