
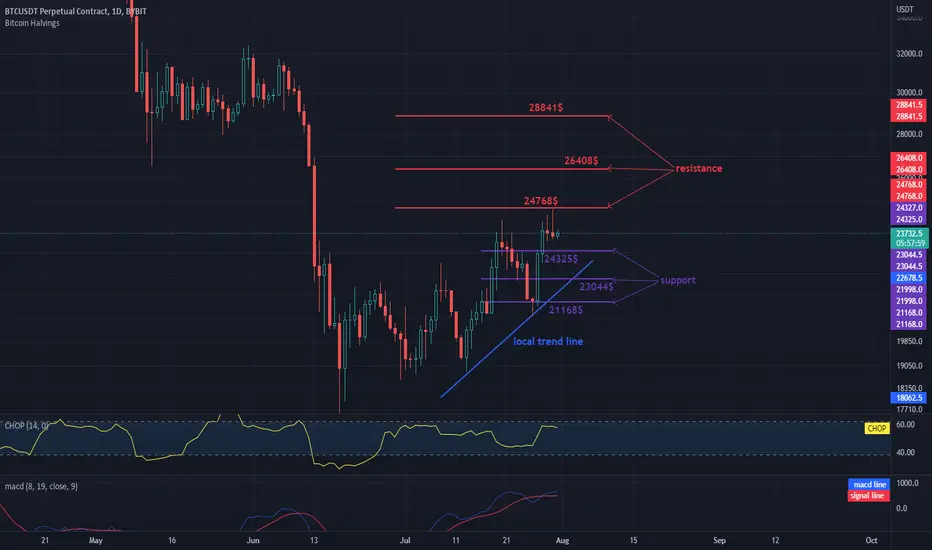
Hello everyone, let's take a look at the BTC to USDT chart on a 1 day timeframe. As you can see, price is moving above the local uptrend line.
Let's start with the designation of the support line and as you can see the first support in the near future is $ 24,325, if the support breaks down, the next support is $ 23,044 and $ 21,168.
Now let's move from the resistance line as you can see the first resistance is $ 24768, if you can break it the next resistance will be $ 26,408 and $ 28,841.
Looking at the CHOP indicator, we can see that we have a lot of energy in the 1-day interval and the MACD indicator shows a local upward trend.
Let's start with the designation of the support line and as you can see the first support in the near future is $ 24,325, if the support breaks down, the next support is $ 23,044 and $ 21,168.
Now let's move from the resistance line as you can see the first resistance is $ 24768, if you can break it the next resistance will be $ 26,408 and $ 28,841.
Looking at the CHOP indicator, we can see that we have a lot of energy in the 1-day interval and the MACD indicator shows a local upward trend.

Pernyataan Penyangkalan
Informasi dan publikasi ini tidak dimaksudkan, dan bukan merupakan, saran atau rekomendasi keuangan, investasi, trading, atau jenis lainnya yang diberikan atau didukung oleh TradingView. Baca selengkapnya di Ketentuan Penggunaan.
Pernyataan Penyangkalan
Informasi dan publikasi ini tidak dimaksudkan, dan bukan merupakan, saran atau rekomendasi keuangan, investasi, trading, atau jenis lainnya yang diberikan atau didukung oleh TradingView. Baca selengkapnya di Ketentuan Penggunaan.