
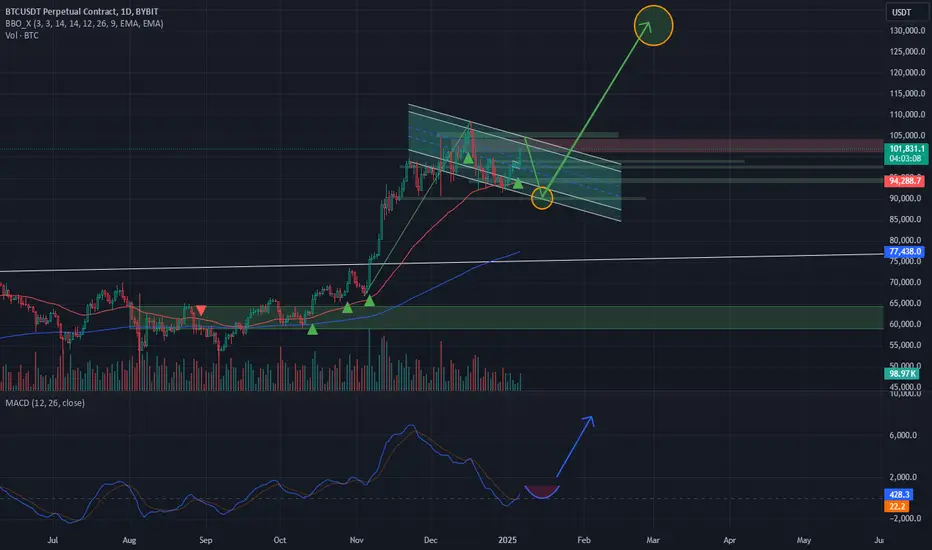
Bull Flag: On the daily timeframe, I’m observing a bull flag formation. Since late December, the price has been moving within a descending channel, acting as a corrective wave after a strong rally. If there is a confirmed breakout above the upper boundary of this channel with sufficient volume, it could signal a continuation of the long-term uptrend.
MACD (12,26,9): The MACD indicator suggests a potential bullish divergence. The histogram is slowly turning positive, and the signal line appears ready to cross above the zero level. This would confirm increasing momentum and support a possible price breakout.
Key S/R Level: The 77,000–80,000 USDT zone looks like a crucial support area, where the price has bounced several times in the past. If BTC does retrace, this zone could act as a strong support.
Final Target at 135,000 USDT: In the event of a successful breakout and continued rally, the price may reach the final target of 135,000 USDT. This target is derived from a combination of price action, trend channel analysis, and Fibonacci levels.
Risks: As always, remember to protect your capital with proper risk management. Technical analysis is never a guarantee of profit—markets can always move the opposite way.
If you like (or disagree with) this idea, please share your thoughts in the comments!
MACD (12,26,9): The MACD indicator suggests a potential bullish divergence. The histogram is slowly turning positive, and the signal line appears ready to cross above the zero level. This would confirm increasing momentum and support a possible price breakout.
Key S/R Level: The 77,000–80,000 USDT zone looks like a crucial support area, where the price has bounced several times in the past. If BTC does retrace, this zone could act as a strong support.
Final Target at 135,000 USDT: In the event of a successful breakout and continued rally, the price may reach the final target of 135,000 USDT. This target is derived from a combination of price action, trend channel analysis, and Fibonacci levels.
Risks: As always, remember to protect your capital with proper risk management. Technical analysis is never a guarantee of profit—markets can always move the opposite way.
If you like (or disagree with) this idea, please share your thoughts in the comments!
Trade aktif
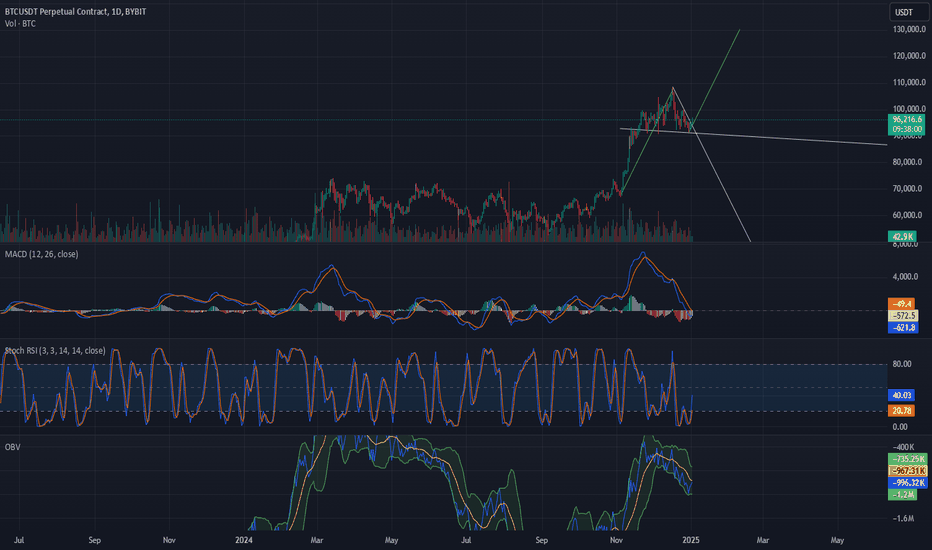
Trading ditutup secara manual
Waiting: 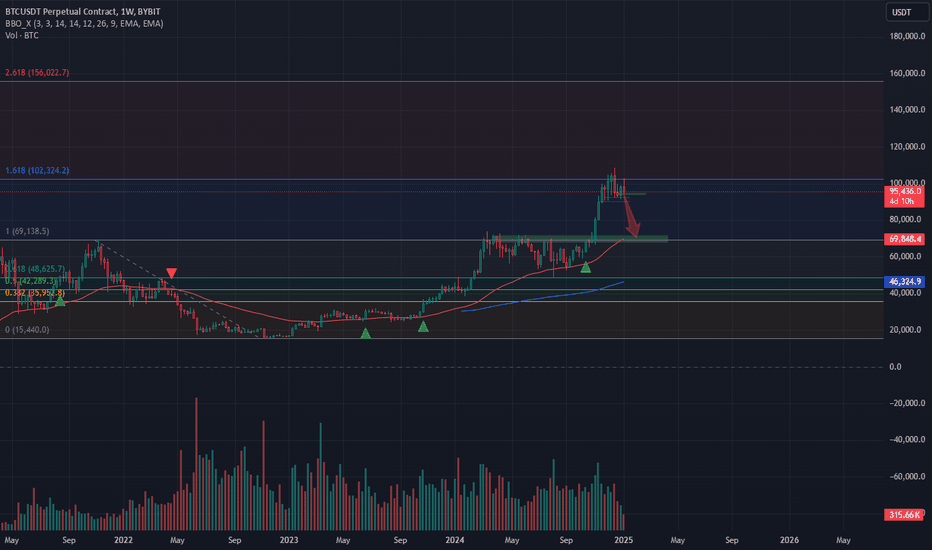
Catatan
Short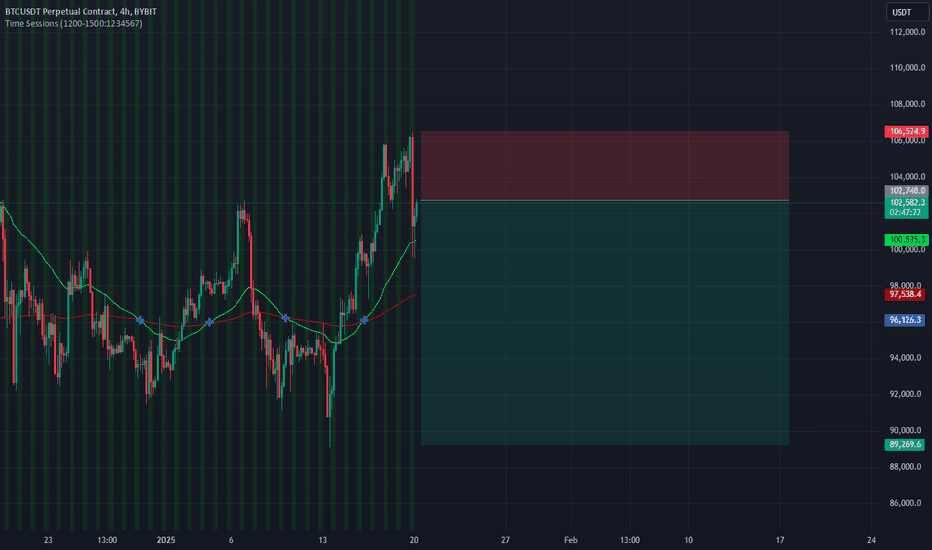

Pernyataan Penyangkalan
Informasi dan publikasi ini tidak dimaksudkan, dan bukan merupakan, saran atau rekomendasi keuangan, investasi, trading, atau jenis lainnya yang diberikan atau didukung oleh TradingView. Baca selengkapnya di Ketentuan Penggunaan.
Pernyataan Penyangkalan
Informasi dan publikasi ini tidak dimaksudkan, dan bukan merupakan, saran atau rekomendasi keuangan, investasi, trading, atau jenis lainnya yang diberikan atau didukung oleh TradingView. Baca selengkapnya di Ketentuan Penggunaan.