
Hello, fellow traders!
Follow us to get the latest information quickly.
Have a great day!
-------------------------------------
I believe BTC is currently at a critical crossroads, where it's either going to continue its uptrend or turn into a downtrend.
(BTCUSDT 1M Chart)
Therefore, support near the M-Signal indicator on the 1M chart is crucial.
Looking at this month's candlestick chart, the StochRSI 20 indicator appears to have formed a new point, rising from 37,155.0 to 87,550.43.
Therefore, caution is advised, as a decline below 87,550.43 could lead to a decline toward the next support and resistance level, near 73,499.86.
Even if the M-Signal indicator on the 1M chart rises above the OBV High indicator at 97,954.51, an uptrend is expected only if it rises above this level.
-
(1W chart)
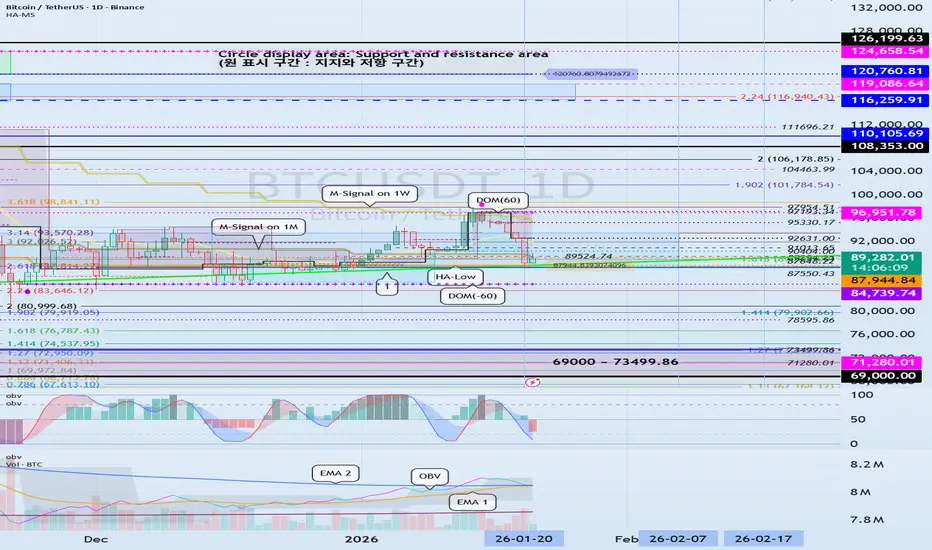
The key is whether the price can rise along the rising trend line (1).
Furthermore, to maintain the price above the M-Signal indicator on the 1M chart, it is crucial to see if the price can rise above the 91013.65 level, which is the StochRSI 50 indicator point, to find support.
-
(1D chart)
The next volatility period is expected to begin around February 7th.
However, since the volatility period shown on the 1W chart is in April, the main volatility period is expected to occur in April.
As the next volatility period passes, the key point to watch is whether the price continues to rise along the rising trend line (1).
Therefore, the price must remain above 89524.74 at the very least.
Currently, the M-Signal on the 1W chart > M-Signal on the 1D chart > M-Signal on the 1M chart, so a complete reversal has not yet occurred.
Therefore, if support is found near the M-Signal indicator on the 1M chart this time, it is expected to move upwards above the M-Signal indicator on the 1W chart.
Considering these points,
1. Key areas to protect: Left Fibonacci ratio 2.618 (87814.27) ~ Left Fibonacci ratio 3.14 (93570.28)
To protect the first key area, support is needed around the 84739.74 ~ 87944.84 area.
To turn to an uptrend and continue the uptrend, the M-Signal indicator on the 1W chart must rise above this level. Based on the current position, this is expected to occur only if the price rises above 95330.17.
-
(15m chart)
For the Heikin-Ashi candlestick to turn bullish, it needs to rise near 92631.0. It's rising.
Based on the chart movement, I believe a rise above 92631.0 will signal a reversal.
Since the M-Signal indicator on the 1D chart is passing near 92631.0, we believe the price must ultimately rise above the M-Signal indicator to maintain its upward momentum.
My basic trading strategy is to buy in the DOM(-60) ~ HA-Low range and sell in the HA-High ~ DOM(60) range.
However, if the price rises from the HA-High to DOM(60) range, it could exhibit a step-like upward trend. If the price falls from the DOM(-60) to HA-Low range, it could exhibit a step-like downward trend.
Therefore, it's recommended to trade using a split trading method.
Looking at the current 15m chart, the DOM(-60) and HA-Low indicators were generated and then rose, but only slightly, generating the DOM(60) indicator.
Therefore, to sustain the upward trend, the DOM(60) indicator must break above the level.
Once you've identified a key point or range, you need to determine whether a break above that point or range can sustain the upward trend.
For this purpose, we use the StochRSI, TC, and OBV indicators.
The StochRSI, TC, and OBV indicators should all be showing upward trends.
If possible, the StochRSI indicator should not have entered an overbought zone. The TC indicator should remain at 0.
The OBV indicator should remain above the High Line.
If the above conditions hold when the DOM (60) indicator breaks above, an attempt to rise above 92631.0 is expected.
If not, a decline towards the HA-Low indicator is likely.
--------------------------------------------------
The final destination is likely to be near the 69K to 73499.86 range, as mentioned at the start of the decline.
However, as always, there is a possibility of a smaller decline and a subsequent rise. Therefore, we need to closely monitor the upward trend, especially when the price rises above the left Fibonacci 2.618 (87814.27) to left Fibonacci 3.14 (93570.28) range and sustains.
Every investor wants to buy at a lower price. However, caution is required, as buying when the price is in a downward trend can be extremely burdensome.
Currently, the price is near the HA-Low indicator on the 1D chart, so if the price falls, it is likely to experience a step-down trend.
This step-down trend ultimately signals a reversal to the upside, so aggressive buying is acceptable. However, investment allocation should be adjusted, as additional buying will be necessary when the HA-Low indicator is met again.
-
Thank you for reading to the end.
I wish you successful trading.
--------------------------------------------------
Trade aktif
#BTCUSDTThe HA-Low indicator on the 1D chart is at 87944.84.
Therefore, support around 87944.84 is crucial.
The overall support range is 84739.74 ~ 87944.84.
The next support range is 69000 ~ 73499.86, so the key is whether support is available in the 84739.74 ~ 87944.84 range.
The next period of volatility is expected to begin around February 7th, so we need to monitor the market until then.

[Practical trading strategy using HA-MS and SBOD]
youtu.be/aceN1AttX1Y
[Web Site]
readcrypto.kr
- Chart pattern analysis has been added.
youtu.be/aceN1AttX1Y
[Web Site]
readcrypto.kr
- Chart pattern analysis has been added.
Publikasi terkait
Pernyataan Penyangkalan
Informasi dan publikasi ini tidak dimaksudkan, dan bukan merupakan, saran atau rekomendasi keuangan, investasi, trading, atau jenis lainnya yang diberikan atau didukung oleh TradingView. Baca selengkapnya di Ketentuan Penggunaan.
[Practical trading strategy using HA-MS and SBOD]
youtu.be/aceN1AttX1Y
[Web Site]
readcrypto.kr
- Chart pattern analysis has been added.
youtu.be/aceN1AttX1Y
[Web Site]
readcrypto.kr
- Chart pattern analysis has been added.
Publikasi terkait
Pernyataan Penyangkalan
Informasi dan publikasi ini tidak dimaksudkan, dan bukan merupakan, saran atau rekomendasi keuangan, investasi, trading, atau jenis lainnya yang diberikan atau didukung oleh TradingView. Baca selengkapnya di Ketentuan Penggunaan.