
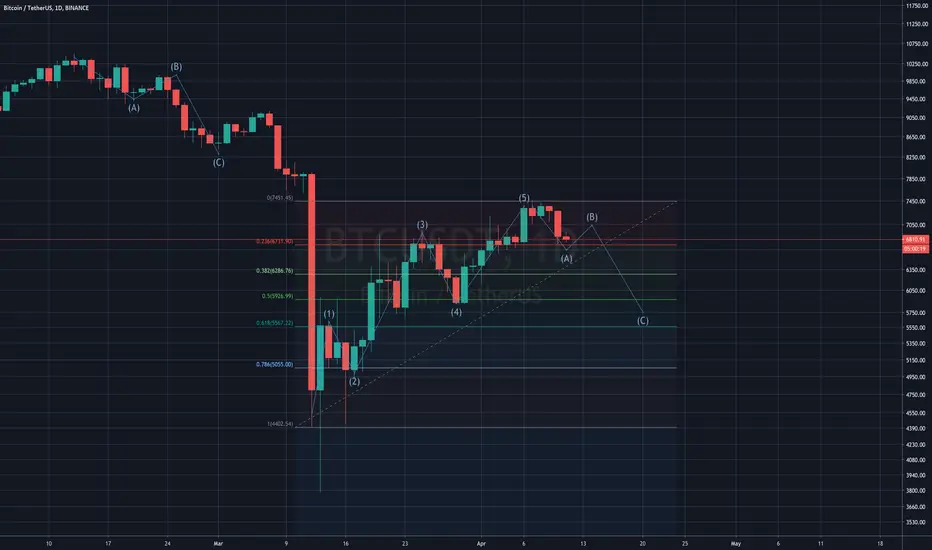
For me, the possible movements of the trend with the application of Elliott's rules are those of the graph. Bitcoins have not broken the resistance at 7,400k USD, by interpolating Elliot's main wave of impulse (Step 5). So now the price follows the waves (ABC) and now it's on (A). The Elliott wave indicates a possible path and price levels, which corresponds exactly to the Fibo graph plotted on the beginning of the pulse wave. Hence it is desirable that in case of bearish the price will go to 6.3 and 5.8k USD. Probably in the next few days.
#surfthetrend
#surfthetrend
Trade aktif
Bull Trap... Trade aktif
Target (B) Reached, Now let's see what happens.Trade aktif
Wave B: ReachedTrade aktif
Corrective and ZigZag into (Master Waves section (A-B)Trade aktif
Bearish Divergences Trade aktif
H&S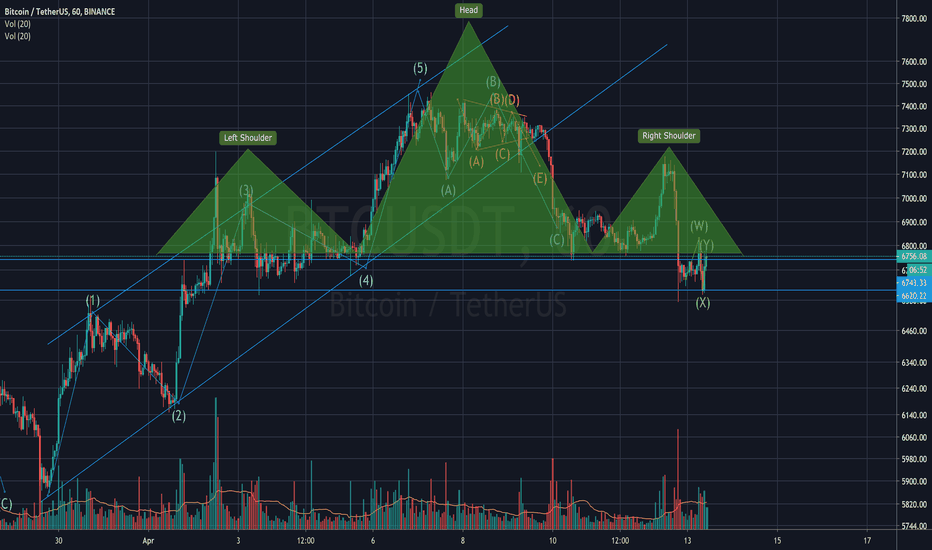
Trade aktif
Hidden divergence has preannunciament this movement Catatan
Wave + Correction Triangle, Top Flat, Bottom rising.
Publikasi terkait
Pernyataan Penyangkalan
Informasi dan publikasi ini tidak dimaksudkan, dan bukan merupakan, saran atau rekomendasi keuangan, investasi, trading, atau jenis lainnya yang diberikan atau didukung oleh TradingView. Baca selengkapnya di Ketentuan Penggunaan.
Publikasi terkait
Pernyataan Penyangkalan
Informasi dan publikasi ini tidak dimaksudkan, dan bukan merupakan, saran atau rekomendasi keuangan, investasi, trading, atau jenis lainnya yang diberikan atau didukung oleh TradingView. Baca selengkapnya di Ketentuan Penggunaan.