
Hello everyone,
Let's take a look at the BTC to USDT 1 day chart.
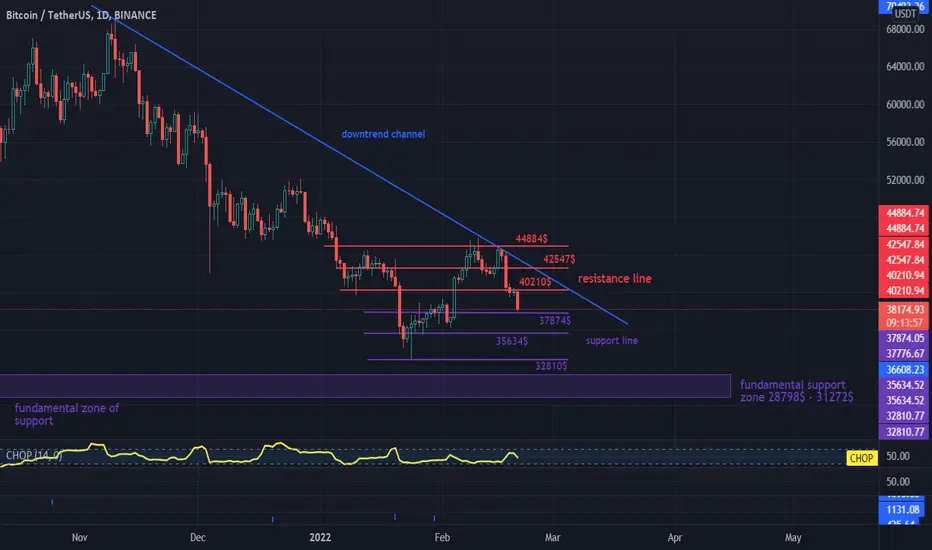
Let's start by determining the downtrend line at which the price is currently moving.
Currently, the price is just above the support at $ 37,874 if we do not defend this level, the next support is at $ 35,634 and $ 32,810, the next support is the fundamental support zone between $ 31,272 and $ 28,798.
However, if the correction is complete, we can determine the first resistance at $ 40,210 and the next resistance at $ 42,547 and $ 44,884.
The CHOP indicator also shows a decrease in energy, but it has not been completely exhausted.

Pernyataan Penyangkalan
Informasi dan publikasi ini tidak dimaksudkan, dan bukan merupakan, saran atau rekomendasi keuangan, investasi, trading, atau jenis lainnya yang diberikan atau didukung oleh TradingView. Baca selengkapnya di Ketentuan Penggunaan.
Pernyataan Penyangkalan
Informasi dan publikasi ini tidak dimaksudkan, dan bukan merupakan, saran atau rekomendasi keuangan, investasi, trading, atau jenis lainnya yang diberikan atau didukung oleh TradingView. Baca selengkapnya di Ketentuan Penggunaan.