
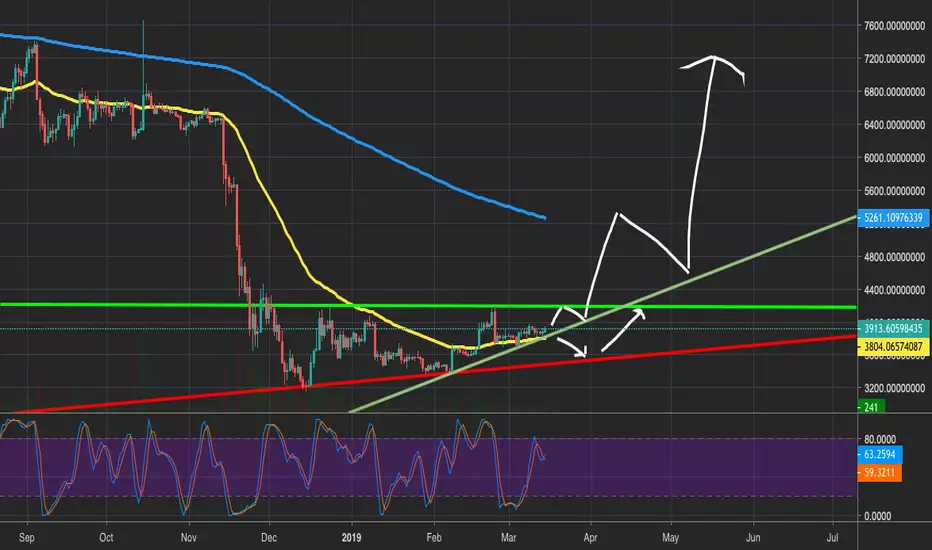
Yellow = 50 EMA
Blue = 300 EMA
After it break the vertical line at $4198. It wil most likely test the 300EMA which is the same as 50EMA on the weekly chart. On the weekly chart, the Stochastic RSI is getting to overbought levels, which is worrying, so we might see a correction soon. We have to wait and see what will happen.
Blue = 300 EMA
After it break the vertical line at $4198. It wil most likely test the 300EMA which is the same as 50EMA on the weekly chart. On the weekly chart, the Stochastic RSI is getting to overbought levels, which is worrying, so we might see a correction soon. We have to wait and see what will happen.

Pernyataan Penyangkalan
Informasi dan publikasi ini tidak dimaksudkan, dan bukan merupakan, saran atau rekomendasi keuangan, investasi, trading, atau jenis lainnya yang diberikan atau didukung oleh TradingView. Baca selengkapnya di Ketentuan Penggunaan.
Pernyataan Penyangkalan
Informasi dan publikasi ini tidak dimaksudkan, dan bukan merupakan, saran atau rekomendasi keuangan, investasi, trading, atau jenis lainnya yang diberikan atau didukung oleh TradingView. Baca selengkapnya di Ketentuan Penggunaan.