
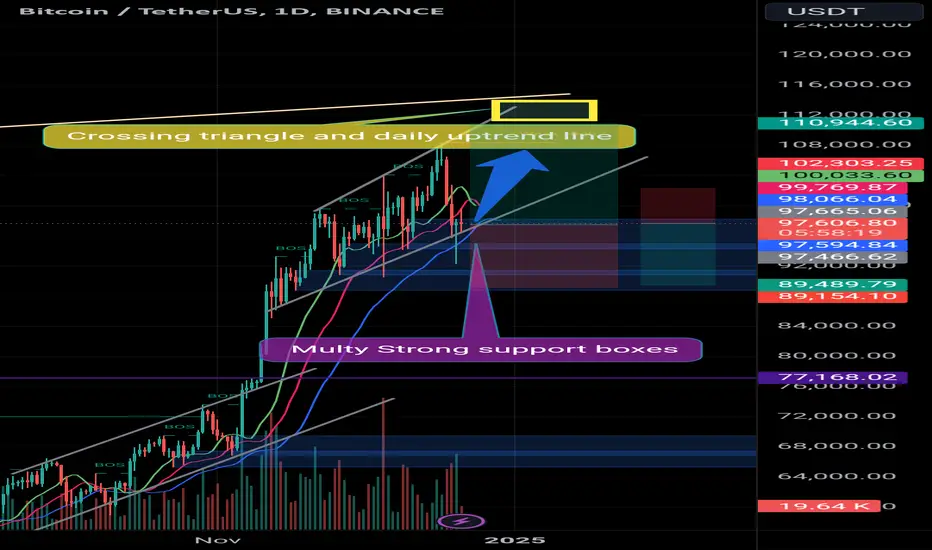
Btc usdt Daily analysis
Time frame daily
Risk rewards ratio >1.6 👈 for buyers
Risk rewards ratio >1.7 👈 for sellers
Technical analysis 👇👇👇
↘️↘️📶📉
An broadening triangle pattern has formed on the daily timeframe and there is a possibility that we will face a decline if the price breaks below the pattern’s bottom. However, we have several strong support areas at $88-$95 that can prevent the market from returning to a bear market. If the sellers get stronger and this support area cannot withstand the pressure from the sellers, Bitcoin will fall to the $77 range.
👉👉📈↗️↗️
On the other hand, if Bitcoin moves up, our first target will be the upper edge of the triangle and the price of $110.
At that time, we need to see if the buyers' power is greater than the sellers'?
If it is, the yellow box, which is the intersection of the long-term uptrend and the price exit area from the triangle, will be our next target, the range between $114 and $118. 🎯🎯🎯
Time frame daily
Risk rewards ratio >1.6 👈 for buyers
Risk rewards ratio >1.7 👈 for sellers
Technical analysis 👇👇👇
↘️↘️📶📉
An broadening triangle pattern has formed on the daily timeframe and there is a possibility that we will face a decline if the price breaks below the pattern’s bottom. However, we have several strong support areas at $88-$95 that can prevent the market from returning to a bear market. If the sellers get stronger and this support area cannot withstand the pressure from the sellers, Bitcoin will fall to the $77 range.
👉👉📈↗️↗️
On the other hand, if Bitcoin moves up, our first target will be the upper edge of the triangle and the price of $110.
At that time, we need to see if the buyers' power is greater than the sellers'?
If it is, the yellow box, which is the intersection of the long-term uptrend and the price exit area from the triangle, will be our next target, the range between $114 and $118. 🎯🎯🎯

Pernyataan Penyangkalan
Informasi dan publikasi ini tidak dimaksudkan, dan bukan merupakan, saran atau rekomendasi keuangan, investasi, trading, atau jenis lainnya yang diberikan atau didukung oleh TradingView. Baca selengkapnya di Ketentuan Penggunaan.
Pernyataan Penyangkalan
Informasi dan publikasi ini tidak dimaksudkan, dan bukan merupakan, saran atau rekomendasi keuangan, investasi, trading, atau jenis lainnya yang diberikan atau didukung oleh TradingView. Baca selengkapnya di Ketentuan Penggunaan.