
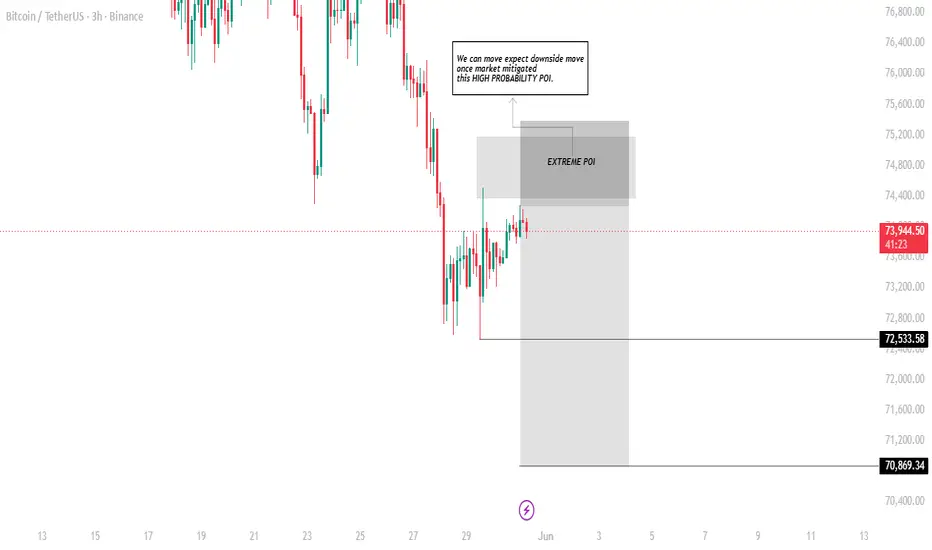
Key Observations
1. Strong Bearish Structure
The sharp sell-off created a clear break in bullish momentum.
Sellers aggressively pushed price from the 76k region down toward 72.5k.
The overall short-term structure remains bearish until higher resistance levels are reclaimed.
2. Current Consolidation
Price is ranging between approximately 72.5k – 74k.
The recent candles show buyers stepping in, but momentum is still relatively weak.
This looks more like a relief bounce than a confirmed trend reversal.
3. Extreme POI (Supply Zone)
Marked around 74.4k – 75.2k.
This is the area where sellers are expected to become active again.
If price reaches this zone, traders will likely watch for:
Rejection candles
Lower-high formation
Increased selling volume
Important Levels
Level Significance
75.2k Upper supply boundary
74.4k Extreme POI / potential short area
72.53k Current support
70.87k Major downside target if support breaks
Bullish Scenario
Price holds above 72.53k.
Buyers push into the POI.
A strong breakout and close above 75.2k could invalidate the bearish expectation and open the door toward the recent highs.
Bearish Scenario (Higher Probability Based on This Markup)
Price rallies into the 74.4k–75.2k supply zone.
Market mitigates the POI.
Sellers step back in and drive price lower.
Initial target: 72.53k
Extended target: 70.87k
Overall Bias
📉 Short-term: Bearish to Neutral
The chart suggests that the current upward movement is a retracement into a high-probability supply zone rather than a confirmed trend reversal. Unless BTC can reclaim and hold above the 75.2k area, the risk of another downside leg remains elevated.
1. Strong Bearish Structure
The sharp sell-off created a clear break in bullish momentum.
Sellers aggressively pushed price from the 76k region down toward 72.5k.
The overall short-term structure remains bearish until higher resistance levels are reclaimed.
2. Current Consolidation
Price is ranging between approximately 72.5k – 74k.
The recent candles show buyers stepping in, but momentum is still relatively weak.
This looks more like a relief bounce than a confirmed trend reversal.
3. Extreme POI (Supply Zone)
Marked around 74.4k – 75.2k.
This is the area where sellers are expected to become active again.
If price reaches this zone, traders will likely watch for:
Rejection candles
Lower-high formation
Increased selling volume
Important Levels
Level Significance
75.2k Upper supply boundary
74.4k Extreme POI / potential short area
72.53k Current support
70.87k Major downside target if support breaks
Bullish Scenario
Price holds above 72.53k.
Buyers push into the POI.
A strong breakout and close above 75.2k could invalidate the bearish expectation and open the door toward the recent highs.
Bearish Scenario (Higher Probability Based on This Markup)
Price rallies into the 74.4k–75.2k supply zone.
Market mitigates the POI.
Sellers step back in and drive price lower.
Initial target: 72.53k
Extended target: 70.87k
Overall Bias
📉 Short-term: Bearish to Neutral
The chart suggests that the current upward movement is a retracement into a high-probability supply zone rather than a confirmed trend reversal. Unless BTC can reclaim and hold above the 75.2k area, the risk of another downside leg remains elevated.

Pernyataan Penyangkalan
Informasi dan publikasi ini tidak dimaksudkan, dan bukan merupakan, saran atau rekomendasi keuangan, investasi, trading, atau jenis lainnya yang diberikan atau didukung oleh TradingView. Baca selengkapnya di Ketentuan Penggunaan.
Pernyataan Penyangkalan
Informasi dan publikasi ini tidak dimaksudkan, dan bukan merupakan, saran atau rekomendasi keuangan, investasi, trading, atau jenis lainnya yang diberikan atau didukung oleh TradingView. Baca selengkapnya di Ketentuan Penggunaan.