
Context
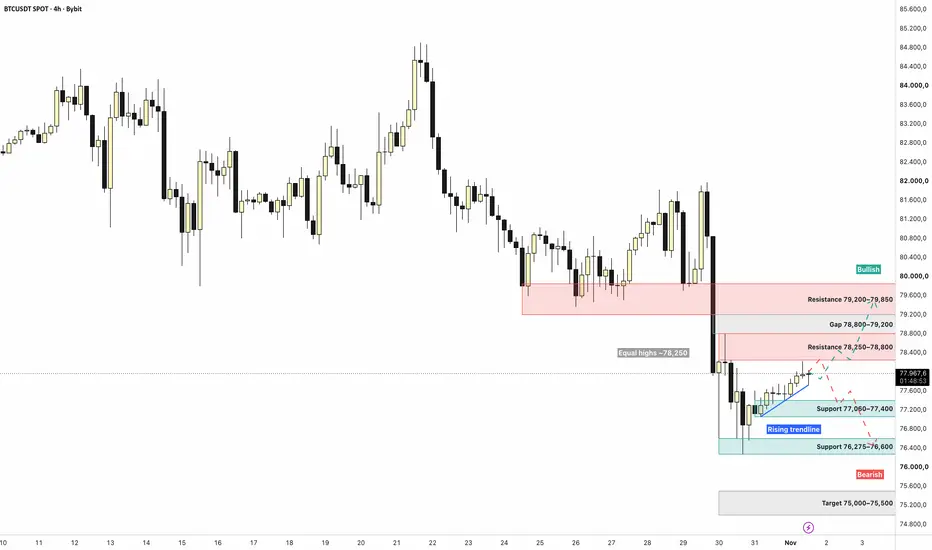
On H4, Bitcoin broke down from its 79,200 – 82,070 range on 29/10 with a single candle from 80,850 to 77,912. That drop left an unfilled imbalance between 78,800 and 80,600. On 30/10 the sell-off swept the 76,500 lows down to 76,275, but the candle closed back at 76,887 and buyers have been in control since.
Current structure
All weekend BTC has printed higher lows along a clean rising trendline, with four touches: 77,060 and 77,400 on 31/10, 77,476 overnight and 77,733 this afternoon. The highs, however, are flat: 78,011, 78,227 and 78,026 today, right under the 78,245 – 78,276 highs from 30/10. Rising lows against a flat ceiling = compression, and the equal highs around 78,250 likely hold buy stops just above. BTC is trading around 77,990, between the trendline (about 77,800) and that ceiling. Weekend volume is thin, so the H4 close matters more than intraday wicks. The current H4 candle has not closed yet.
Key levels
🔴 79,200 – 79,850: resistance, old range base broken on 29/10
⚪ 78,800 – 79,200: lower part of the unfilled 29/10 gap
🔴 78,250 – 78,800: resistance, 30/10 lower highs and equal highs
🟢 77,060 – 77,400: support, weekend base under the trendline
🟢 76,275 – 76,600: support, 30/10 sweep low
⚪ 75,000 – 75,500: target below the sweep low
Scenarios
🟢 Bullish: the trendline holds, then an H4 close above 78,300 clears the equal highs → move to 78,800, then into the gap toward 79,200 – 79,850. Invalidation: H4 close below 77,400.
🔴 Bearish: a sweep of 78,250 that closes back below, or another rejection there, then an H4 close below the trendline → move back to 77,060 – 77,400, then a retest of 76,275 – 76,600; a close below 76,275 would open 75,000 – 75,500. Invalidation: H4 close above 78,800.
Summary
BTC is coiling between a rising trendline and a flat ceiling at 78,250, with liquidity resting just above the equal highs. An H4 close above 78,300 would open 78,800 and the gap up to 79,850; a break of the trendline would put 77,060 – 77,400 and then the 76,275 lows back in play.
Educational analysis only, not investment advice.
On H4, Bitcoin broke down from its 79,200 – 82,070 range on 29/10 with a single candle from 80,850 to 77,912. That drop left an unfilled imbalance between 78,800 and 80,600. On 30/10 the sell-off swept the 76,500 lows down to 76,275, but the candle closed back at 76,887 and buyers have been in control since.
Current structure
All weekend BTC has printed higher lows along a clean rising trendline, with four touches: 77,060 and 77,400 on 31/10, 77,476 overnight and 77,733 this afternoon. The highs, however, are flat: 78,011, 78,227 and 78,026 today, right under the 78,245 – 78,276 highs from 30/10. Rising lows against a flat ceiling = compression, and the equal highs around 78,250 likely hold buy stops just above. BTC is trading around 77,990, between the trendline (about 77,800) and that ceiling. Weekend volume is thin, so the H4 close matters more than intraday wicks. The current H4 candle has not closed yet.
Key levels
🔴 79,200 – 79,850: resistance, old range base broken on 29/10
⚪ 78,800 – 79,200: lower part of the unfilled 29/10 gap
🔴 78,250 – 78,800: resistance, 30/10 lower highs and equal highs
🟢 77,060 – 77,400: support, weekend base under the trendline
🟢 76,275 – 76,600: support, 30/10 sweep low
⚪ 75,000 – 75,500: target below the sweep low
Scenarios
🟢 Bullish: the trendline holds, then an H4 close above 78,300 clears the equal highs → move to 78,800, then into the gap toward 79,200 – 79,850. Invalidation: H4 close below 77,400.
🔴 Bearish: a sweep of 78,250 that closes back below, or another rejection there, then an H4 close below the trendline → move back to 77,060 – 77,400, then a retest of 76,275 – 76,600; a close below 76,275 would open 75,000 – 75,500. Invalidation: H4 close above 78,800.
Summary
BTC is coiling between a rising trendline and a flat ceiling at 78,250, with liquidity resting just above the equal highs. An H4 close above 78,300 would open 78,800 and the gap up to 79,850; a break of the trendline would put 77,060 – 77,400 and then the 76,275 lows back in play.
Educational analysis only, not investment advice.

4 years trading, 4 years of mistakes. I built LossLens: a journal that shows why you lose, trade by trade. MT4/MT5.
👉 losslens.app
👉 losslens.app
Pernyataan Penyangkalan
Informasi dan publikasi ini tidak dimaksudkan, dan bukan merupakan, saran atau rekomendasi keuangan, investasi, trading, atau jenis lainnya yang diberikan atau didukung oleh TradingView. Baca selengkapnya di Ketentuan Penggunaan.
4 years trading, 4 years of mistakes. I built LossLens: a journal that shows why you lose, trade by trade. MT4/MT5.
👉 losslens.app
👉 losslens.app
Pernyataan Penyangkalan
Informasi dan publikasi ini tidak dimaksudkan, dan bukan merupakan, saran atau rekomendasi keuangan, investasi, trading, atau jenis lainnya yang diberikan atau didukung oleh TradingView. Baca selengkapnya di Ketentuan Penggunaan.