
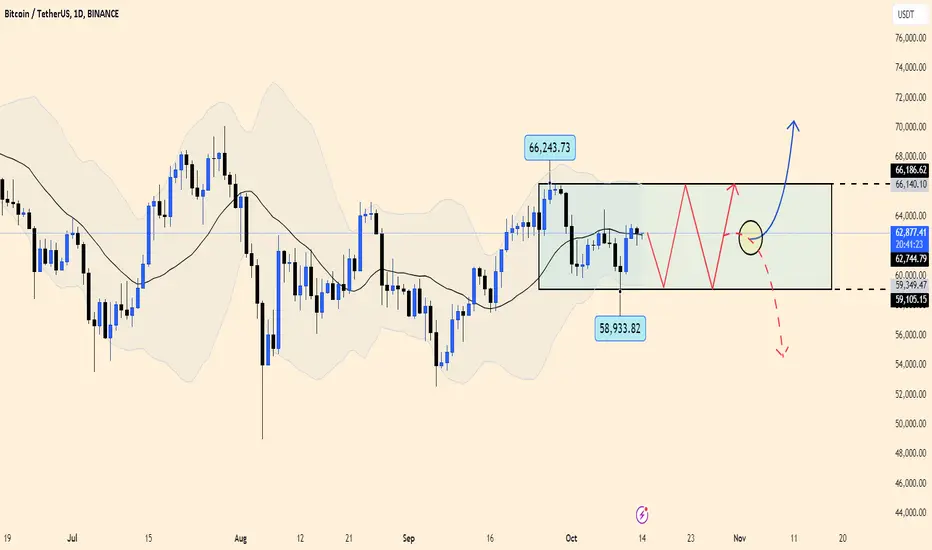
The chart illustrates a sideways movement, with Bitcoin’s price fluctuating within a range defined by the upper and lower bands of the Bollinger Bands. The support and resistance levels are clearly marked around $58,933.82 and $66,186.62, respectively. The price action is constrained between these limits, indicating a lack of momentum and a consolidation phase.
The EMA 34 and 89 are showing weak activity, reflecting the indecisiveness in the market, with no clear signs of a breakout either upwards or downwards. Until the EMAs show a stronger trend signal, the market is likely to remain in this sideways range.
In conclusion, the market is in a consolidation phase, and traders should wait for a breakout from the Bollinger Bands for a clearer direction.
The EMA 34 and 89 are showing weak activity, reflecting the indecisiveness in the market, with no clear signs of a breakout either upwards or downwards. Until the EMAs show a stronger trend signal, the market is likely to remain in this sideways range.
In conclusion, the market is in a consolidation phase, and traders should wait for a breakout from the Bollinger Bands for a clearer direction.

Publikasi terkait
Pernyataan Penyangkalan
Informasi dan publikasi ini tidak dimaksudkan, dan bukan merupakan, saran atau rekomendasi keuangan, investasi, trading, atau jenis lainnya yang diberikan atau didukung oleh TradingView. Baca selengkapnya di Ketentuan Penggunaan.
Publikasi terkait
Pernyataan Penyangkalan
Informasi dan publikasi ini tidak dimaksudkan, dan bukan merupakan, saran atau rekomendasi keuangan, investasi, trading, atau jenis lainnya yang diberikan atau didukung oleh TradingView. Baca selengkapnya di Ketentuan Penggunaan.