
Bitcoin will soon fall to the $3200 again!
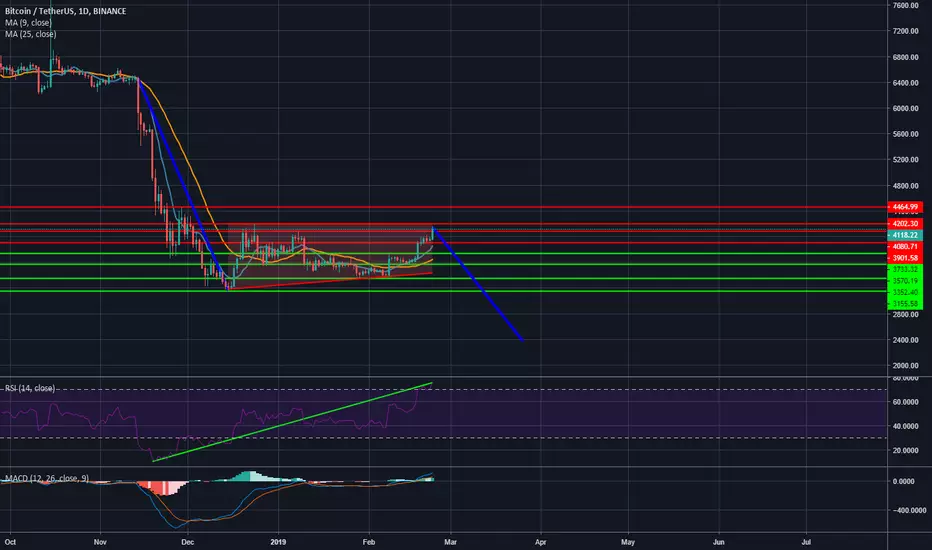
There is an obvious bearflag in the BTC/USDT chart. Which is a sign for downfall. When the lower trendline breaks, it triggers panic sellers as the downtrend resumes another leg down. Just like the bull flag, the severity of the drop on the flagpole determines how strong the bear flag can be.
I use the RSI as momentum indicator. On a crossover with the 70 i'll sell and by a crossover the 30 i'll buy, if their is a flag pattern.
Keep in mind that this is just speculation!
There is an obvious bearflag in the BTC/USDT chart. Which is a sign for downfall. When the lower trendline breaks, it triggers panic sellers as the downtrend resumes another leg down. Just like the bull flag, the severity of the drop on the flagpole determines how strong the bear flag can be.
I use the RSI as momentum indicator. On a crossover with the 70 i'll sell and by a crossover the 30 i'll buy, if their is a flag pattern.
Keep in mind that this is just speculation!

Pernyataan Penyangkalan
Informasi dan publikasi ini tidak dimaksudkan, dan bukan merupakan, saran atau rekomendasi keuangan, investasi, trading, atau jenis lainnya yang diberikan atau didukung oleh TradingView. Baca selengkapnya di Ketentuan Penggunaan.
Pernyataan Penyangkalan
Informasi dan publikasi ini tidak dimaksudkan, dan bukan merupakan, saran atau rekomendasi keuangan, investasi, trading, atau jenis lainnya yang diberikan atau didukung oleh TradingView. Baca selengkapnya di Ketentuan Penggunaan.