
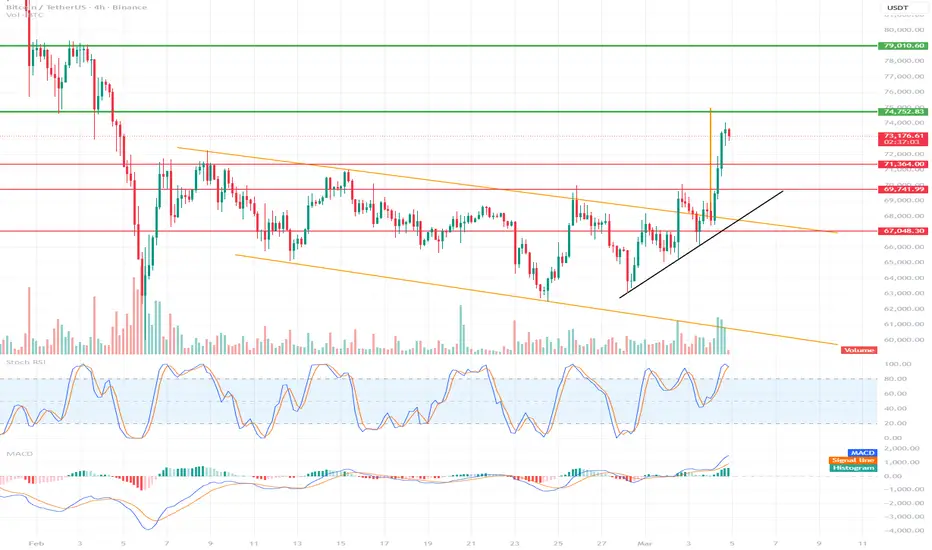
1️⃣ Market Structure
The most important thing to see:
The price has broken out of the downward channel (orange lines)
A strong impulse breakout has occurred
The breakout has broken through:
The downward trendline
Resistance 69.7k
Resistance 71.3k
This is a change in market structure → bullish.
The black line shows a valid impulse + potential retest.
📈 Key Levels
🟢 Resistance
74,750 – very strong resistance (currently being tested)
77,100
79,000 – macro resistance
🔴 Support
71,300 – fresh support
69,740
67,050 – very strong
Most important level now:
👉 71,300
If maintained, the uptrend continues.
📉 Indicators
Stoch RSI
is high (overbought)
A short pullback is possible
This is normal after such an impulse.
MACD
Fresh bullish crossover
The histogram is rising
Momentum is rising
This usually means a few more bullish candles remain.
📊 Volume
The breakout showed:
📈 high volume
This is important because:
the breakout is real
does not look like a fake breakout
🔮 Scenarios
🟢 Bullish (more likely)
Pullback to:
71.3k – 72k
and beyond:
🎯 74.7k → 77k → 79k
🟡 Consolidation
The price could box:
71k – 75k
for a few days before moving higher.
🔴 Bearish (only after a break)
If it drops below:
69,700
then possible:
67k
65k
But there is no bearish signal yet.
🧠 The most important thing that happened
This is key:
👉 BTC has broken out of a downtrend
meaning:
the structure is changing to bullish
the next leg of growth is possible
⭐ My conclusion
Short-term:
📉 a small pullback is possible
Medium-term:
📈 77k – 79k is realistic
The most important thing to see:
The price has broken out of the downward channel (orange lines)
A strong impulse breakout has occurred
The breakout has broken through:
The downward trendline
Resistance 69.7k
Resistance 71.3k
This is a change in market structure → bullish.
The black line shows a valid impulse + potential retest.
📈 Key Levels
🟢 Resistance
74,750 – very strong resistance (currently being tested)
77,100
79,000 – macro resistance
🔴 Support
71,300 – fresh support
69,740
67,050 – very strong
Most important level now:
👉 71,300
If maintained, the uptrend continues.
📉 Indicators
Stoch RSI
is high (overbought)
A short pullback is possible
This is normal after such an impulse.
MACD
Fresh bullish crossover
The histogram is rising
Momentum is rising
This usually means a few more bullish candles remain.
📊 Volume
The breakout showed:
📈 high volume
This is important because:
the breakout is real
does not look like a fake breakout
🔮 Scenarios
🟢 Bullish (more likely)
Pullback to:
71.3k – 72k
and beyond:
🎯 74.7k → 77k → 79k
🟡 Consolidation
The price could box:
71k – 75k
for a few days before moving higher.
🔴 Bearish (only after a break)
If it drops below:
69,700
then possible:
67k
65k
But there is no bearish signal yet.
🧠 The most important thing that happened
This is key:
👉 BTC has broken out of a downtrend
meaning:
the structure is changing to bullish
the next leg of growth is possible
⭐ My conclusion
Short-term:
📉 a small pullback is possible
Medium-term:
📈 77k – 79k is realistic

Pernyataan Penyangkalan
Informasi dan publikasi ini tidak dimaksudkan, dan bukan merupakan, saran atau rekomendasi keuangan, investasi, trading, atau jenis lainnya yang diberikan atau didukung oleh TradingView. Baca selengkapnya di Ketentuan Penggunaan.
Pernyataan Penyangkalan
Informasi dan publikasi ini tidak dimaksudkan, dan bukan merupakan, saran atau rekomendasi keuangan, investasi, trading, atau jenis lainnya yang diberikan atau didukung oleh TradingView. Baca selengkapnya di Ketentuan Penggunaan.