
Hello?
Nice to meet you, fellow traders.
If you "follow" me, you can always get new information quickly.
Have a great day today.
------------------------------------
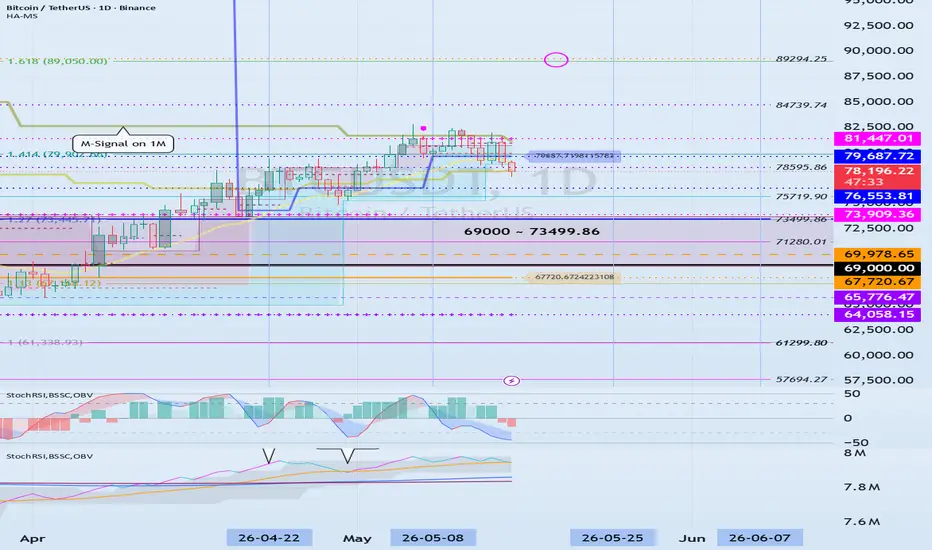
(1D Chart)
It appears that the volatility period has changed as a downtrend line (4) has formed.
The next period of volatility is expected to run from around May 25 to around June 7.
The most important factor is whether the price can maintain its upward trend above the uptrend line (1).
Therefore, I believe the range from 67720.67 to 69978.65 corresponds to a buying zone.
If a sharp decline occurs, the price may touch the area between 64058.15 and 65776.47, so countermeasures for this should also be considered.
We need to observe which direction the price deviates from downtrend lines (3) or (4) during the volatility period after falling along downtrend lines (3) and (4).
To break out of the bottom zone, the price must rise above 89294.25 and maintain its position.
If the price rises above the M-Signal indicator on the 1M chart and maintains its position during the upcoming volatility period, it will be the final buying opportunity.
Therefore, you must verify whether the price can rise above 81447.01 and maintain it.
If you were unable to buy near the M-Signal indicator on the 1M chart, a breakout trade is possible when the price breaks above the 89294.25 point.
However, you must have a strategy in place to respond to up-and-down fluctuations.
-
(1M Chart)
June is a month corresponding to a period of significant volatility.
Therefore, if the price maintains above the upward trend line (1) and continues the uptrend in June, a BTC bull market is expected to begin.
Consequently, we forecast a high probability that the bull market will start in July.
-
Thank you for reading to the end.
I wish you successful trading.
--------------------------------------------------
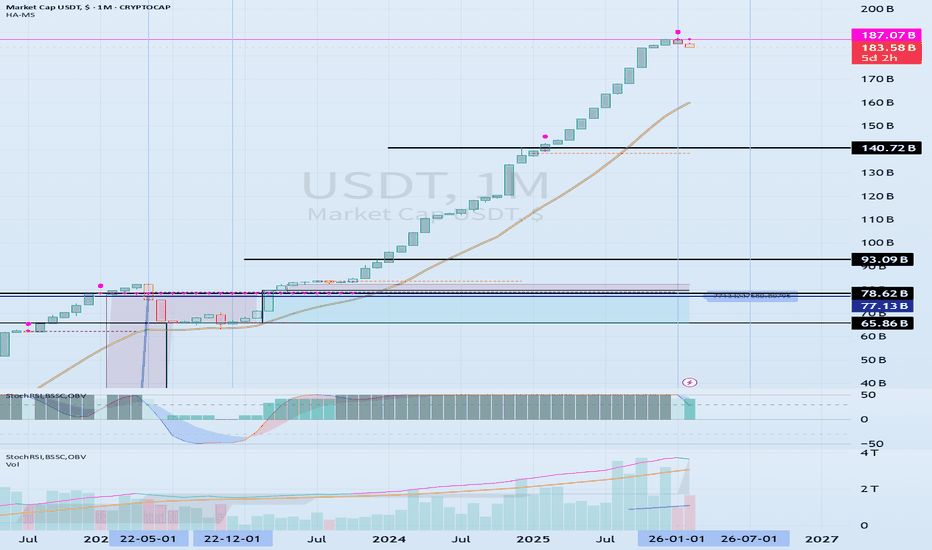
(The coin market is expected to start its uptrend in July)
-
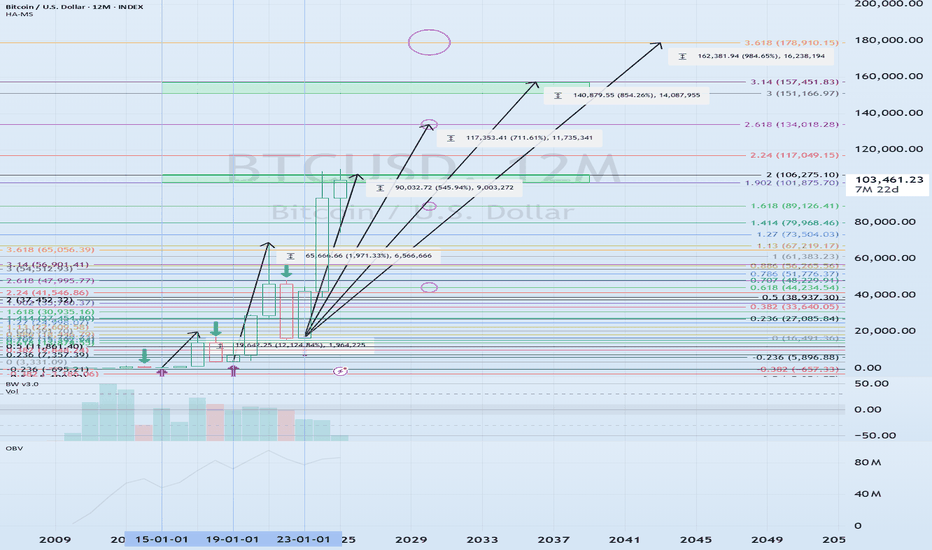
- This is an explanation of the big picture.
(3-year bull market, 1-year bear market pattern)
------------------------------------------------------
Catatan
#BTCUSDT(1D Chart)
The key question is whether it can find support around the 75719.90 ~ 76553.81 range and rise above 81447.01.
(15m Chart)
It is expected that a breakout above the 77424.22 ~ 77639.98 range will lead to further gains.
At this point, we need to monitor whether the OBV indicator rises above EMA 3.

YouTube: youtube.com/@readcrypto9837
※ Follow X to check out the posts.
※ X를 팔로우하고 게시물을 확인하세요.
◆ t.me/readCryptoChannel
[HA-MS Indicator]
bit.ly/3YxHgvN
[OBV Indicator]
bit.ly/4dcyny3
※ Follow X to check out the posts.
※ X를 팔로우하고 게시물을 확인하세요.
◆ t.me/readCryptoChannel
[HA-MS Indicator]
bit.ly/3YxHgvN
[OBV Indicator]
bit.ly/4dcyny3
Publikasi terkait
Pernyataan Penyangkalan
Informasi dan publikasi ini tidak dimaksudkan, dan bukan merupakan, saran atau rekomendasi keuangan, investasi, trading, atau jenis lainnya yang diberikan atau didukung oleh TradingView. Baca selengkapnya di Ketentuan Penggunaan.
YouTube: youtube.com/@readcrypto9837
※ Follow X to check out the posts.
※ X를 팔로우하고 게시물을 확인하세요.
◆ t.me/readCryptoChannel
[HA-MS Indicator]
bit.ly/3YxHgvN
[OBV Indicator]
bit.ly/4dcyny3
※ Follow X to check out the posts.
※ X를 팔로우하고 게시물을 확인하세요.
◆ t.me/readCryptoChannel
[HA-MS Indicator]
bit.ly/3YxHgvN
[OBV Indicator]
bit.ly/4dcyny3
Publikasi terkait
Pernyataan Penyangkalan
Informasi dan publikasi ini tidak dimaksudkan, dan bukan merupakan, saran atau rekomendasi keuangan, investasi, trading, atau jenis lainnya yang diberikan atau didukung oleh TradingView. Baca selengkapnya di Ketentuan Penggunaan.