Pembelian
BitShares - The Curve
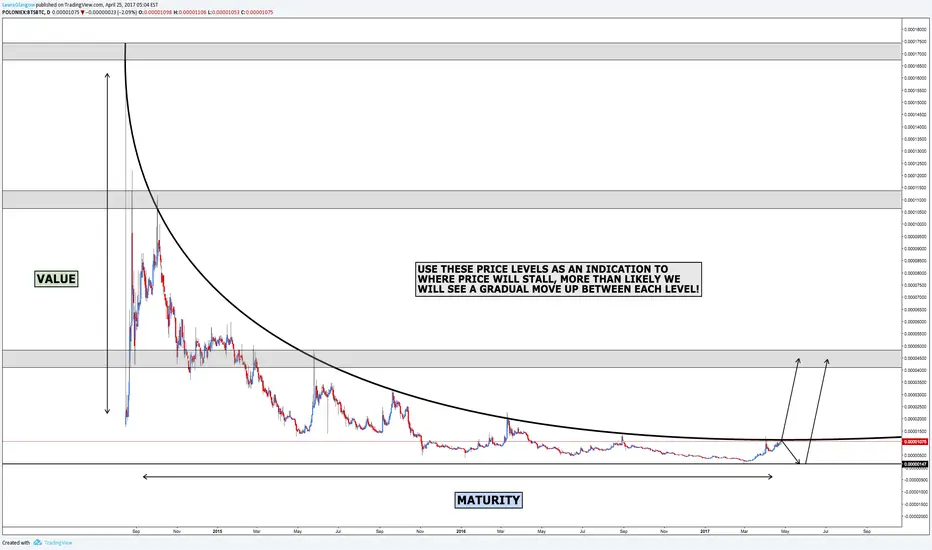
I'm back with another market insight on cryptocurrencies, today I'm on the daily chart with BTS/BTC.
This idea is extremely similar to my post yesterday with Ripple (chart is shown below).
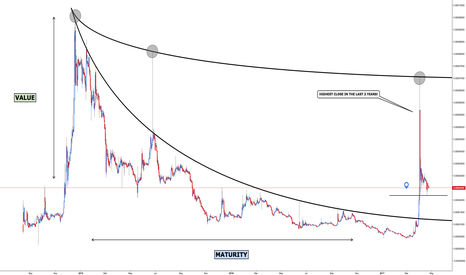
Again, just like XRP this cryptocurrency is one that has definitely become more and more appealing over the past couple of months, especially now because of the potential return short and long term.
The curve presented on the chart can be seen across various financial markets and is simply a representation of an asset becoming less valuable over a long period of time.
As price is pushed towards the lowest possible value there are three potential outcomes:
1. BitShares will crash (highly unlikely).
2. It will continue to trade below the curve.
3. Experience a huge breakout to the upside.
I'm expecting a big move up this year! I'll be using the three key zones highlighted in grey as an indication to where price will stall before continuing the move up.
This post was merely an introduction to the technical side of BitShares, but I hope you gained a lot of insight from this short piece of analysis.
Updates to follow! Don't forget to add me on social media :)
This idea is extremely similar to my post yesterday with Ripple (chart is shown below).
Again, just like XRP this cryptocurrency is one that has definitely become more and more appealing over the past couple of months, especially now because of the potential return short and long term.
The curve presented on the chart can be seen across various financial markets and is simply a representation of an asset becoming less valuable over a long period of time.
As price is pushed towards the lowest possible value there are three potential outcomes:
1. BitShares will crash (highly unlikely).
2. It will continue to trade below the curve.
3. Experience a huge breakout to the upside.
I'm expecting a big move up this year! I'll be using the three key zones highlighted in grey as an indication to where price will stall before continuing the move up.
This post was merely an introduction to the technical side of BitShares, but I hope you gained a lot of insight from this short piece of analysis.
Updates to follow! Don't forget to add me on social media :)
Catatan
Next stop 0.00004500.Catatan
Price has now broken out of the descending channel on the 5m chart, expecting more upside movement.Catatan
Approaching our first target level, secure some profit before the next move.Trading ditutup: target tercapai
Well done to all those who held BTS, seriously.
📈 Master the Art and Science of Trading: sixfigurecapital.com
Publikasi terkait
Pernyataan Penyangkalan
Informasi dan publikasi ini tidak dimaksudkan, dan bukan merupakan, saran atau rekomendasi keuangan, investasi, trading, atau jenis lainnya yang diberikan atau didukung oleh TradingView. Baca selengkapnya di Ketentuan Penggunaan.