
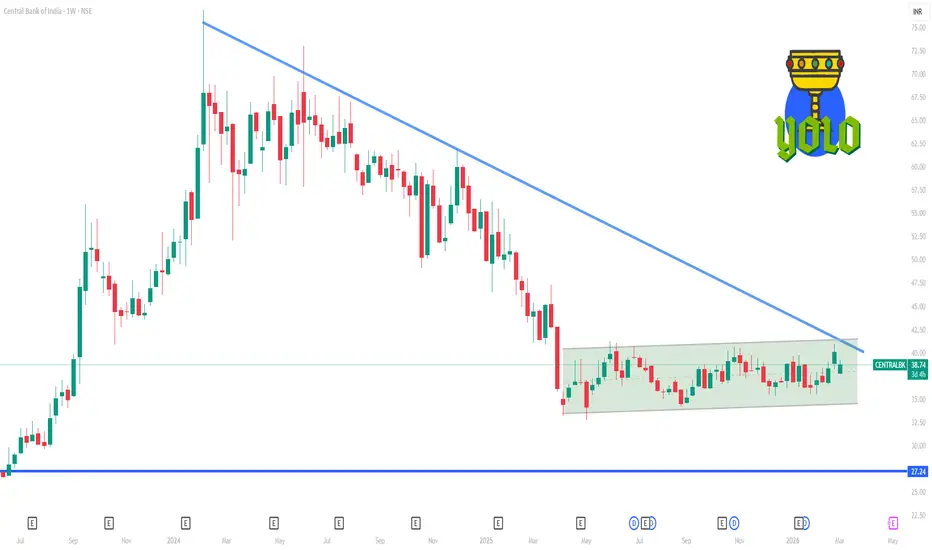
📊 Current Snapshot (as of early March 2026)
Recent price ~ ₹38.7 – ₹39.0 on the NSE.
52-week range: Low ~ ₹32.7, High ~ ₹47.3.
🔑 Weekly Time Frame Levels (1-week support & resistance)
📈 Resistance Zones
These are levels that the price may struggle to cross above in the near term:
₹39.0–39.4: near current pivot and immediate weekly resistance.
₹40.2–40.4: next resistance cluster — break above this helps bullish continuation.
₹41+: overhead bigger resistance if upside momentum builds.
Key Weekly Resistances:
🔥 R1 ~ ₹39.1
🔥 R2 ~ ₹39.45–39.99
🔥 R3 ~ ₹40.25–40.44
📉 Support Zones
Important levels where the price may find buyers on dips:
₹38.0–38.6: first line of support (near short-term moving averages & pivot-based support).
₹37.4–37.7: deeper weekly support — breach could hint at more correction.
₹36.8–36.0: larger lower support cluster if broader weakness appears.
Key Weekly Supports:
🛡️ S1 ~ ₹38.0–38.6
🛡️ S2 ~ ₹37.4–37.7
🛡️ S3 ~ ₹36.8–36.0
📌 Interpretation (Weekly)
Bullish bias on weekly breakout above ~₹40.4 — strengthens medium-term uptrend if confirmed on volume.
Bearish continuation below ~₹37.4 — could signal downside trend continuation within the recent range.
Between ₹38–40 is currently the key consolidation range traders watch this week.
📊 Other Notes
Many oscillator and moving average indicators (like RSI) around neutral to slightly bullish on weekly charts — so breakout direction matters more than current momentum.
Classic pivot studies often give additional weekly pivot values near ₹37.1–38.0 as key reaction points.

Contact Knowledgehub for a detailed consultation: Dm on WhatsApp: [wa.link/a2o0kz]-
Phone No: [+91 93102 26243]-
Email: [tradingviewknowledgehub@gmail.com]---
-- Let’s achieve success together!
Phone No: [+91 93102 26243]-
Email: [tradingviewknowledgehub@gmail.com]---
-- Let’s achieve success together!
Publikasi terkait
Pernyataan Penyangkalan
Informasi dan publikasi ini tidak dimaksudkan, dan bukan merupakan, saran atau rekomendasi keuangan, investasi, trading, atau jenis lainnya yang diberikan atau didukung oleh TradingView. Baca selengkapnya di Ketentuan Penggunaan.