
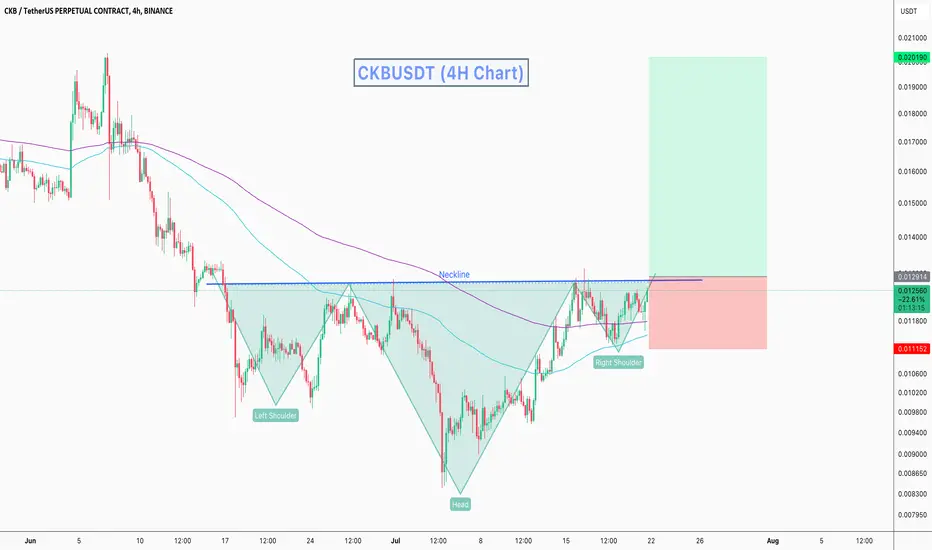
CKBUSDT Technical analysis update
CKB price is forming an inverse head and shoulders pattern. The price of the right shoulder is now moving towards the neckline for a potential breakout, 100 and 200 EMA act as good support for the right shoulder. If the breakout occurs, we can expect a strong bullish move in CKB.
Only buy after the neckline breakout.
Stop Loss: $0.0111

🚀Telegram : t.me/hexatrades
🌐Website: hexatrades.io/
🗣️Twitter(X): twitter.com/HexaTrades
🌐Website: hexatrades.io/
🗣️Twitter(X): twitter.com/HexaTrades
Publikasi terkait
Pernyataan Penyangkalan
Informasi dan publikasi ini tidak dimaksudkan, dan bukan merupakan, saran atau rekomendasi keuangan, investasi, trading, atau jenis lainnya yang diberikan atau didukung oleh TradingView. Baca selengkapnya di Ketentuan Penggunaan.