
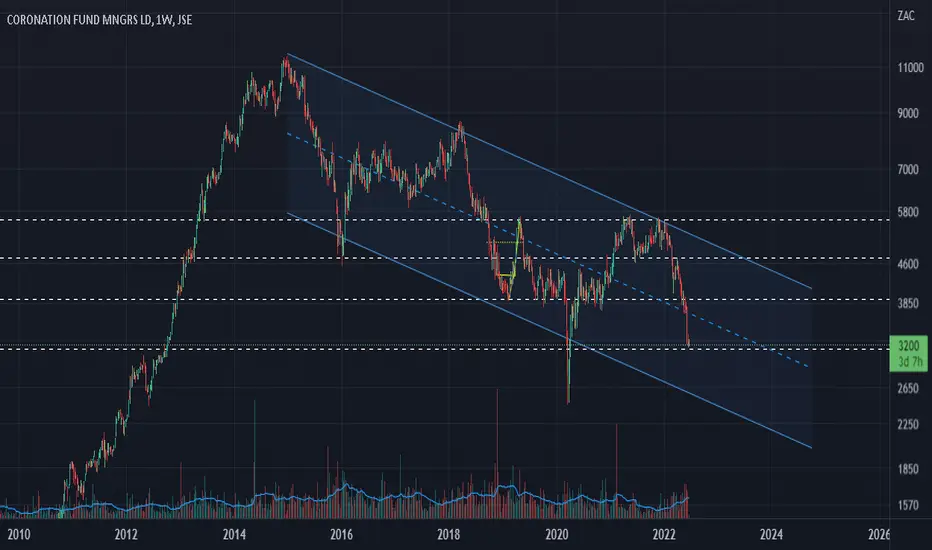
Is #CML #Coronation a buy at these levels?
Well on a weekly graph, over the past couple of years this share has traded in a descending channel. We are currently just below the mid-point of this channel.
Image 1
TD indicator on the weekly chart shows extreme oversold levels and we have reached a perfected 9.

Image 2
The stochastic indicator shows extreme oversold conditions.

Image 3
On an hourly graph the share is consolidating round R32.20, whilst the stochastic has pulled back a bit. This may set up the short term graph for a pop to the top, which will in turn initiate the turnaround on the weekly chart.

We might see Coronation running from here to close the ex-div gap at around R36.60.
Fundamentals:
Coronation is currently trading at a 7.5 PE and 13.5 DY dividend yield, which gives some protection if the share is to retest the 2020 lows as part of a capitulation turnaround.
Well on a weekly graph, over the past couple of years this share has traded in a descending channel. We are currently just below the mid-point of this channel.
Image 1
TD indicator on the weekly chart shows extreme oversold levels and we have reached a perfected 9.
Image 2
The stochastic indicator shows extreme oversold conditions.
Image 3
On an hourly graph the share is consolidating round R32.20, whilst the stochastic has pulled back a bit. This may set up the short term graph for a pop to the top, which will in turn initiate the turnaround on the weekly chart.
We might see Coronation running from here to close the ex-div gap at around R36.60.
Fundamentals:
Coronation is currently trading at a 7.5 PE and 13.5 DY dividend yield, which gives some protection if the share is to retest the 2020 lows as part of a capitulation turnaround.

Pernyataan Penyangkalan
Informasi dan publikasi ini tidak dimaksudkan, dan bukan merupakan, saran atau rekomendasi keuangan, investasi, trading, atau jenis lainnya yang diberikan atau didukung oleh TradingView. Baca selengkapnya di Ketentuan Penggunaan.
Pernyataan Penyangkalan
Informasi dan publikasi ini tidak dimaksudkan, dan bukan merupakan, saran atau rekomendasi keuangan, investasi, trading, atau jenis lainnya yang diberikan atau didukung oleh TradingView. Baca selengkapnya di Ketentuan Penggunaan.