
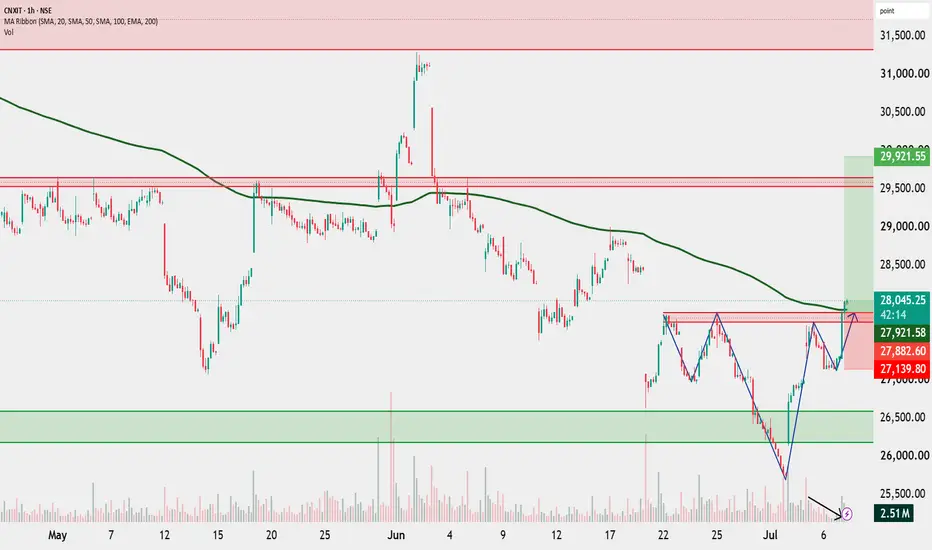
CNX IT is forming an Inverse Head and Shoulder pattern while also showing a bullish market structure with higher highs and higher lows after a Change of Character (ChoCH). Price is testing the neckline and the 200 EMA, making this a crucial resistance zone. A sustained close above 27,900–28,000 would confirm a Break of Structure (BOS) and strengthen the bullish outlook. Volume has declined during the pullback, indicating weak selling pressure. Wait for a confirmed breakout before taking any position.
Disclaimer: For educational purposes only. Not an investment recommendation. Please consult your registered financial advisor. I am only a SEBI Certified Research Analyst.
Disclaimer: For educational purposes only. Not an investment recommendation. Please consult your registered financial advisor. I am only a SEBI Certified Research Analyst.

Publikasi terkait
Pernyataan Penyangkalan
Informasi dan publikasi ini tidak dimaksudkan, dan bukan merupakan, saran atau rekomendasi keuangan, investasi, trading, atau jenis lainnya yang diberikan atau didukung oleh TradingView. Baca selengkapnya di Ketentuan Penggunaan.
Publikasi terkait
Pernyataan Penyangkalan
Informasi dan publikasi ini tidak dimaksudkan, dan bukan merupakan, saran atau rekomendasi keuangan, investasi, trading, atau jenis lainnya yang diberikan atau didukung oleh TradingView. Baca selengkapnya di Ketentuan Penggunaan.