
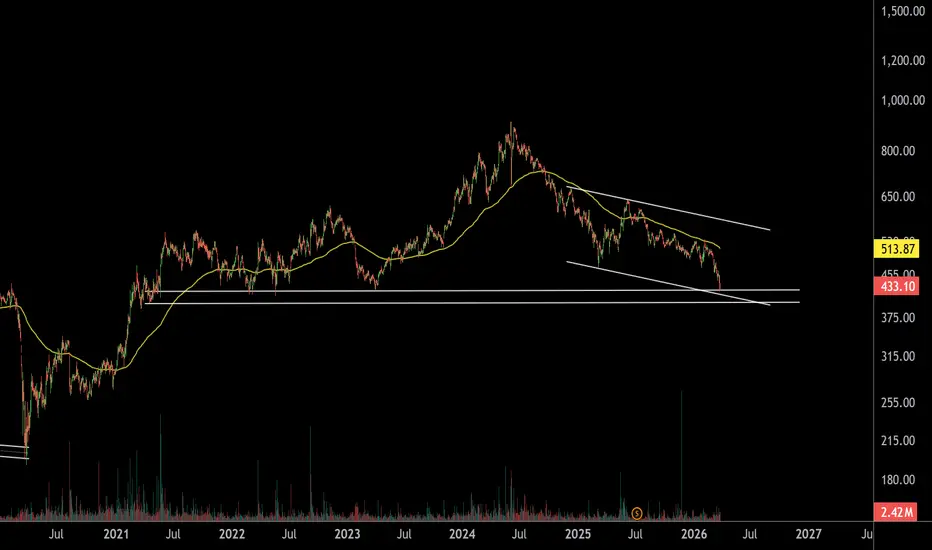
CONCOR – Daily Timeframe Analysis
This is the daily timeframe chart of CONCOR. The stock is currently trading near a strong support zone around 400–420, based on the Fibonacci retracement levels.
The price is also moving within a falling channel, with additional support seen near the 400–410 area.
A minimum upside target of 500 is possible. However, the price is currently trading below the EMA, which indicates weakness. Even if a reversal occurs, the price may first retest the EMA and then face selling pressure again.
If the support holds, we can expect a move from 400 to 500.
This is the daily timeframe chart of CONCOR. The stock is currently trading near a strong support zone around 400–420, based on the Fibonacci retracement levels.
The price is also moving within a falling channel, with additional support seen near the 400–410 area.
A minimum upside target of 500 is possible. However, the price is currently trading below the EMA, which indicates weakness. Even if a reversal occurs, the price may first retest the EMA and then face selling pressure again.
If the support holds, we can expect a move from 400 to 500.

@RahulSarawagi
Connect us at optionlab.co.in/
Connect us at optionlab.co.in/
Pernyataan Penyangkalan
Informasi dan publikasi ini tidak dimaksudkan, dan bukan merupakan, saran atau rekomendasi keuangan, investasi, trading, atau jenis lainnya yang diberikan atau didukung oleh TradingView. Baca selengkapnya di Ketentuan Penggunaan.
@RahulSarawagi
Connect us at optionlab.co.in/
Connect us at optionlab.co.in/
Pernyataan Penyangkalan
Informasi dan publikasi ini tidak dimaksudkan, dan bukan merupakan, saran atau rekomendasi keuangan, investasi, trading, atau jenis lainnya yang diberikan atau didukung oleh TradingView. Baca selengkapnya di Ketentuan Penggunaan.