
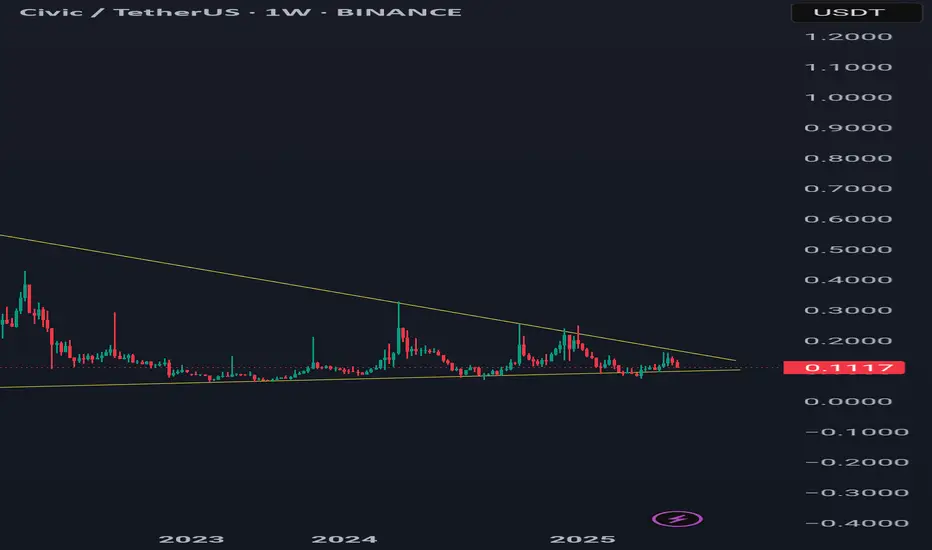
The chart shows the ongoing corrective phase of Civic (CVC) within a larger bullish Elliott Wave structure. Key observations:
1. Wave [A] (Impulse Wave):
Price surged from $0.01 to $0.80 (Nov 2020 - April 2021).
The movement displays a classic 5-wave impulse structure, with Wave 3 being the most extended.
2. Wave [B] (Correction):
A complex, time-consuming corrective phase has been unfolding since 2021.
The current price action is forming a symmetrical triangle, often seen in Wave [B].
3. Wave [C] (Potential Upward Movement):
After Wave [B] completes, a significant bullish Wave [C] is expected.
Target levels (based on Fibonacci retracement of Wave [A]):
61.8%: $0.50
100%: $0.80
161.8%: $1.20+ (Extended targets
Key Levels to Watch:
Watch for a break above $0.12 - $0.15 to confirm the start of Wave [C].
A sustained break of the downward trendline will signal a strong move upwards.
In Conclusion: Civic (CVC) is nearing the end of its Wave [B] correction, and a breakout to the upside in Wave [C] is highly probable, potentially driving prices back to the highs.
Feel free to paste this directly on TradingView!

Pernyataan Penyangkalan
Informasi dan publikasi ini tidak dimaksudkan, dan bukan merupakan, saran atau rekomendasi keuangan, investasi, trading, atau jenis lainnya yang diberikan atau didukung oleh TradingView. Baca selengkapnya di Ketentuan Penggunaan.
Pernyataan Penyangkalan
Informasi dan publikasi ini tidak dimaksudkan, dan bukan merupakan, saran atau rekomendasi keuangan, investasi, trading, atau jenis lainnya yang diberikan atau didukung oleh TradingView. Baca selengkapnya di Ketentuan Penggunaan.