 Indeks Rata-rata Industri Dow Jones
Pembelian
A look at a century of logarithmic Dow - it's not a bubble!
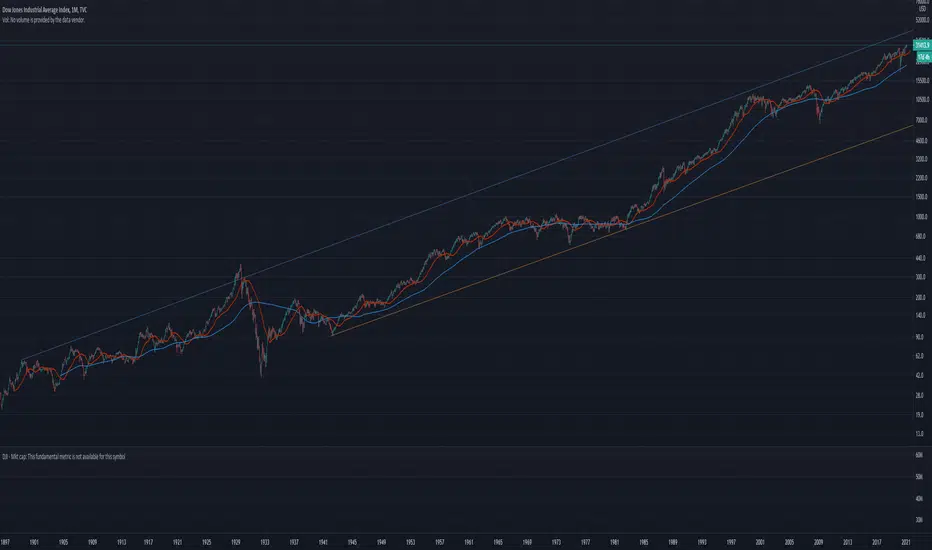
I keep hearing that stocks are in a bubble, but that just isn't true. People always look at charts in a linear mode, but this is not how math works. To get accurate prices and movement we MUST look at a logarithmic chart. When you do this for the Dow Jones average for the last century you clearly see we perhaps are a little inflated, but nowhere near Bubble territory. You want a Bubble? 1929 - now *that* was wildly over valued (with a subsequent epic crash). Now if in 2023 the Dow is above 45k? Then you can get back to me about how we might be in an asset Bubble. Until then I expect the trend to continue bullish.

Pernyataan Penyangkalan
Informasi dan publikasi ini tidak dimaksudkan, dan bukan merupakan, saran atau rekomendasi keuangan, investasi, trading, atau jenis lainnya yang diberikan atau didukung oleh TradingView. Baca selengkapnya di Ketentuan Penggunaan.
Pernyataan Penyangkalan
Informasi dan publikasi ini tidak dimaksudkan, dan bukan merupakan, saran atau rekomendasi keuangan, investasi, trading, atau jenis lainnya yang diberikan atau didukung oleh TradingView. Baca selengkapnya di Ketentuan Penggunaan.