
hi traders,
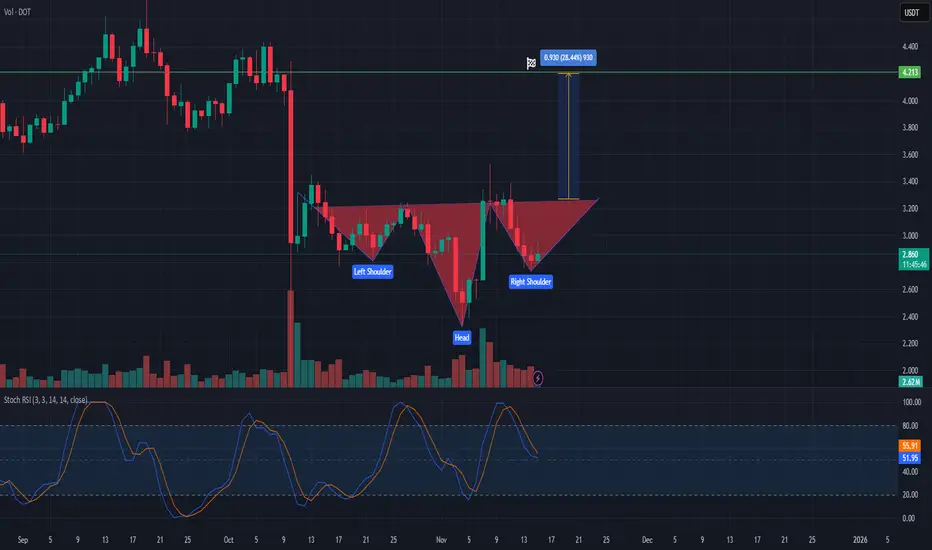
DOT is currently forming a bullish inverted head and shoulders pattern on the daily chart, suggesting a potential medium-term trend reversal to the upside.
Left Shoulder: Price declines and rebounds, creating the first swing low.
Head: A deeper sell-off forms the lowest point of the structure before buyers step back in.
Right Shoulder: Price is now developing the right shoulder, with higher lows indicating strengthening bullish momentum.
The neckline resistance sits slightly above the current price. A confirmed daily close above the neckline would complete the pattern and trigger a potential breakout.
The projected target, measured from the head to the neckline and extended upward from the breakout point, suggests an approximate 28% upside move, with the target area around 4.21 USDT.
The Stochastic RSI is currently in mid-range and curling upward, providing additional momentum support for a potential bullish breakout.
Trading Plan Considerations:
Entry: Upon a decisive breakout and daily close above the neckline.
Target: ~4.21 USDT (pattern completion target).
Invalidation: Breakdown below the right shoulder low would invalidate this setup.
DOT is currently forming a bullish inverted head and shoulders pattern on the daily chart, suggesting a potential medium-term trend reversal to the upside.
Left Shoulder: Price declines and rebounds, creating the first swing low.
Head: A deeper sell-off forms the lowest point of the structure before buyers step back in.
Right Shoulder: Price is now developing the right shoulder, with higher lows indicating strengthening bullish momentum.
The neckline resistance sits slightly above the current price. A confirmed daily close above the neckline would complete the pattern and trigger a potential breakout.
The projected target, measured from the head to the neckline and extended upward from the breakout point, suggests an approximate 28% upside move, with the target area around 4.21 USDT.
The Stochastic RSI is currently in mid-range and curling upward, providing additional momentum support for a potential bullish breakout.
Trading Plan Considerations:
Entry: Upon a decisive breakout and daily close above the neckline.
Target: ~4.21 USDT (pattern completion target).
Invalidation: Breakdown below the right shoulder low would invalidate this setup.

💥 Free signals and ideas ➡ t.me/vfinvestment
Pernyataan Penyangkalan
Informasi dan publikasi ini tidak dimaksudkan, dan bukan merupakan, saran atau rekomendasi keuangan, investasi, trading, atau jenis lainnya yang diberikan atau didukung oleh TradingView. Baca selengkapnya di Ketentuan Penggunaan.
💥 Free signals and ideas ➡ t.me/vfinvestment
Pernyataan Penyangkalan
Informasi dan publikasi ini tidak dimaksudkan, dan bukan merupakan, saran atau rekomendasi keuangan, investasi, trading, atau jenis lainnya yang diberikan atau didukung oleh TradingView. Baca selengkapnya di Ketentuan Penggunaan.