
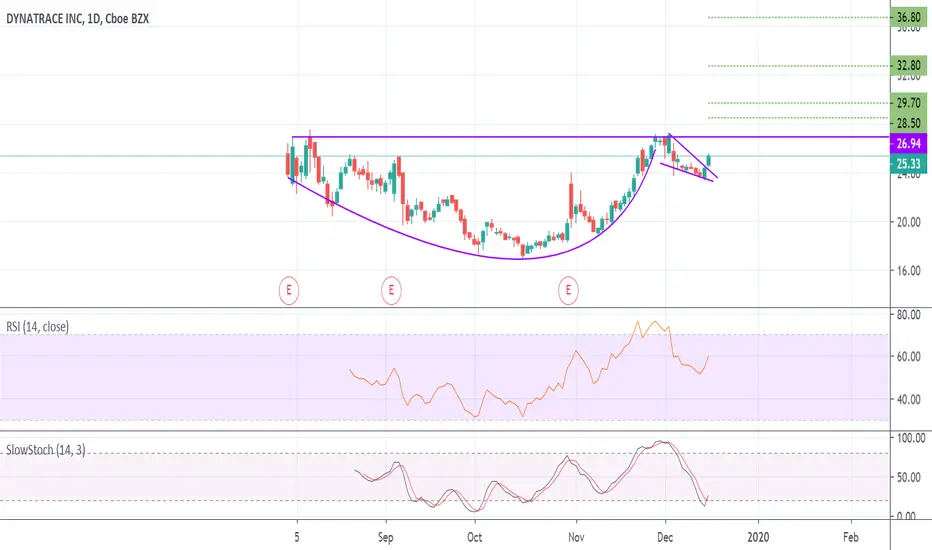
Dynatrace has not been actively traded for very long but the daily chart has created a cup & handle pattern which just needs a breakout for confirmation. The backside of the pattern can be interpreted as a bull flag that would have broken out during today's trading session. Notice how the RSI held the 50 level as well as the stock exits an oversold condition. The Sector, Industry, & stock all have relative strength against the SPX as well.
My first two price targets that are noted on the chart are Fibonacci extension levels. The third target is based on the bull flag breakout while the fourth target would be if we receive confirmation of the cup & handle breakout.
My first two price targets that are noted on the chart are Fibonacci extension levels. The third target is based on the bull flag breakout while the fourth target would be if we receive confirmation of the cup & handle breakout.

Pernyataan Penyangkalan
Informasi dan publikasi ini tidak dimaksudkan, dan bukan merupakan, saran atau rekomendasi keuangan, investasi, trading, atau jenis lainnya yang diberikan atau didukung oleh TradingView. Baca selengkapnya di Ketentuan Penggunaan.
Pernyataan Penyangkalan
Informasi dan publikasi ini tidak dimaksudkan, dan bukan merupakan, saran atau rekomendasi keuangan, investasi, trading, atau jenis lainnya yang diberikan atau didukung oleh TradingView. Baca selengkapnya di Ketentuan Penggunaan.