
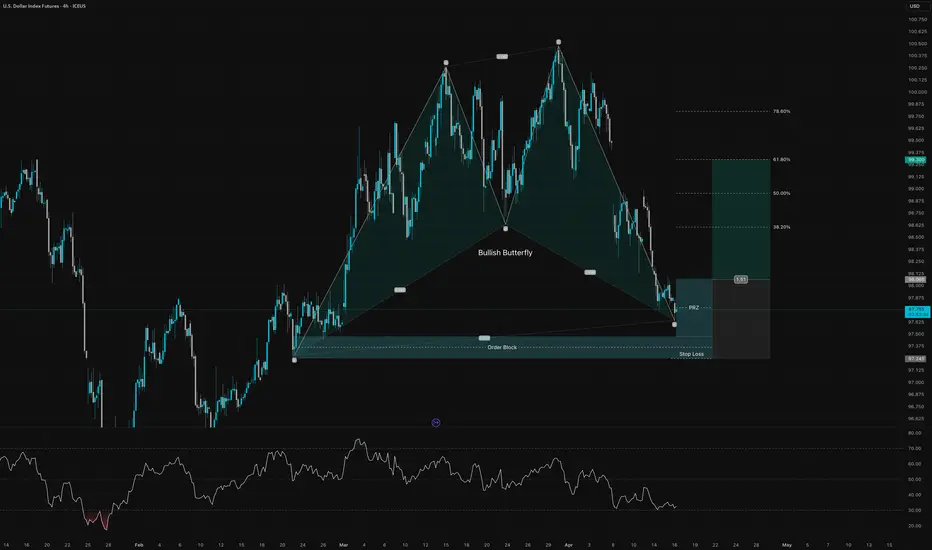
On the 4H chart, U.S. Dollar Index Futures are approaching a technically important reaction zone after completing a Bullish Butterfly harmonic pattern. The pattern terminates inside a well-defined PRZ (Potential Reversal Zone) around the 97.60–97.25 area, which also overlaps with a prior order block. This confluence makes the current region highly relevant for a possible bullish reaction.
After the strong selloff from the recent highs, price has now reached a zone where downside momentum may start to fade. In addition, RSI is trading in a weak area, suggesting the market is already stretched on the downside. That does not guarantee an immediate reversal, but it does support the idea that sellers may be losing momentum near support.
As long as price holds above the lower boundary of the PRZ and the stop-loss area around 97.25, a recovery move toward the next Fibonacci retracement levels becomes increasingly likely. The first upside targets are located near the 38.2% retracement, followed by the 50.0% and 61.8% levels, with the latter sitting around 99.30 and acting as the main bullish target in this setup.
The bullish idea would be invalidated by a clear break below the PRZ and stop-loss zone, as that would suggest the harmonic support has failed and sellers remain in full control.
Overall, this is a countertrend bullish setup inside a larger bearish move, so confirmation through price action is important. If buyers defend the PRZ, the chart offers an attractive rebound opportunity with a favorable risk-to-reward structure.
After the strong selloff from the recent highs, price has now reached a zone where downside momentum may start to fade. In addition, RSI is trading in a weak area, suggesting the market is already stretched on the downside. That does not guarantee an immediate reversal, but it does support the idea that sellers may be losing momentum near support.
As long as price holds above the lower boundary of the PRZ and the stop-loss area around 97.25, a recovery move toward the next Fibonacci retracement levels becomes increasingly likely. The first upside targets are located near the 38.2% retracement, followed by the 50.0% and 61.8% levels, with the latter sitting around 99.30 and acting as the main bullish target in this setup.
The bullish idea would be invalidated by a clear break below the PRZ and stop-loss zone, as that would suggest the harmonic support has failed and sellers remain in full control.
Overall, this is a countertrend bullish setup inside a larger bearish move, so confirmation through price action is important. If buyers defend the PRZ, the chart offers an attractive rebound opportunity with a favorable risk-to-reward structure.
Trade aktif
Trading ditutup: target tercapai
Take Profit 1 reached
Pernyataan Penyangkalan
Informasi dan publikasi ini tidak dimaksudkan, dan bukan merupakan, saran atau rekomendasi keuangan, investasi, trading, atau jenis lainnya yang diberikan atau didukung oleh TradingView. Baca selengkapnya di Ketentuan Penggunaan.
Pernyataan Penyangkalan
Informasi dan publikasi ini tidak dimaksudkan, dan bukan merupakan, saran atau rekomendasi keuangan, investasi, trading, atau jenis lainnya yang diberikan atau didukung oleh TradingView. Baca selengkapnya di Ketentuan Penggunaan.