
Monday, September 10, 2023
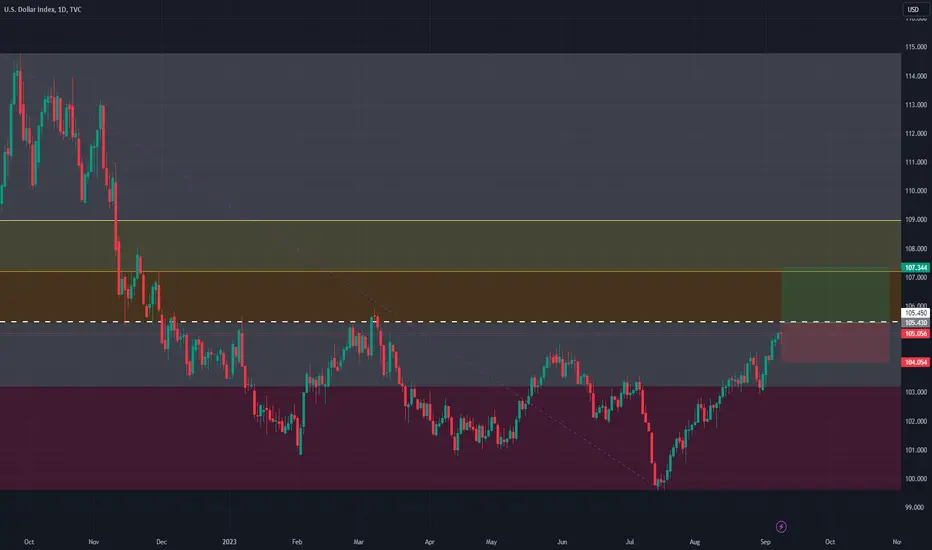
In the weekly chart of the US #Dollar Index, the market structure appears #bullish. Recently, the market found support around the 104 level, and the Dollar #Index has reached the 38.2% Fibonacci retracement level as part of a corrective move.
In this week's trading, if the current #uptrend continues, and the 38.2% resistance level at 105.45 is #broken, the market may find a clear path towards the 50% Fibonacci #retracement at the 107 level.
However, if the #resistance zone at 105.45 holds its ground, the #upward #momentum in the market may be limited, and the Dollar Index could return to the 104 #support level, marking a 23.6% #Fibonacci #retracement #correction.
So based on this analysis I suggests a bullish outlook for the Dollar Index.

Pernyataan Penyangkalan
Informasi dan publikasi ini tidak dimaksudkan, dan bukan merupakan, saran atau rekomendasi keuangan, investasi, trading, atau jenis lainnya yang diberikan atau didukung oleh TradingView. Baca selengkapnya di Ketentuan Penggunaan.
Pernyataan Penyangkalan
Informasi dan publikasi ini tidak dimaksudkan, dan bukan merupakan, saran atau rekomendasi keuangan, investasi, trading, atau jenis lainnya yang diberikan atau didukung oleh TradingView. Baca selengkapnya di Ketentuan Penggunaan.