
hello
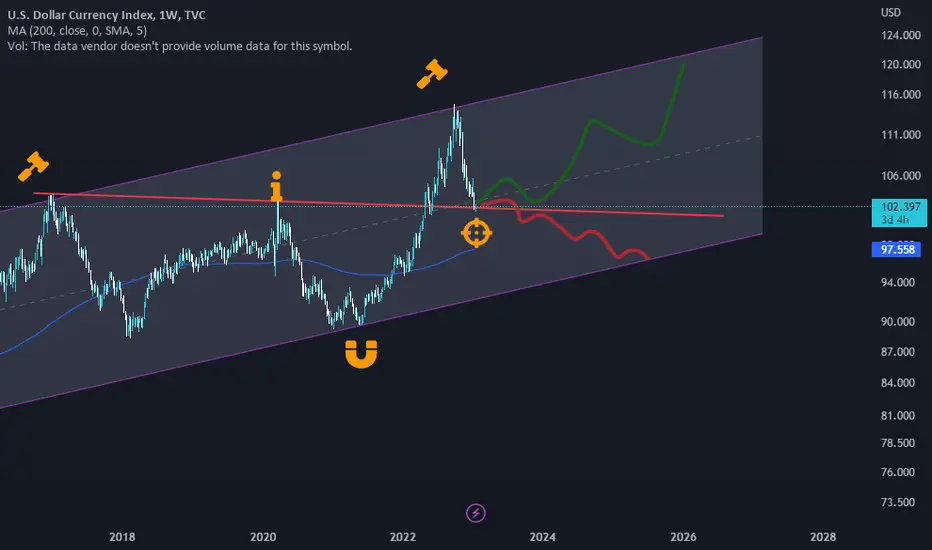
my analyze on DXY chart is a bullish channel
price hit top of channel and then goes down, 1 week ago hitted an Support(Was Resistance before) and react to it, now i can goes top again or break it and then goes to bottom of channel.
also here it is 0.618 Fibo from last bullish wave but price have bearish momentum ,
lets see what will happen and waiting for confirmations.
Hope you enjoy this analyze and like it,
comment your idea about DXY.
Follow for more analyze.
my analyze on DXY chart is a bullish channel
price hit top of channel and then goes down, 1 week ago hitted an Support(Was Resistance before) and react to it, now i can goes top again or break it and then goes to bottom of channel.
also here it is 0.618 Fibo from last bullish wave but price have bearish momentum ,
lets see what will happen and waiting for confirmations.
Hope you enjoy this analyze and like it,
comment your idea about DXY.
Follow for more analyze.

Pernyataan Penyangkalan
Informasi dan publikasi ini tidak dimaksudkan, dan bukan merupakan, saran atau rekomendasi keuangan, investasi, trading, atau jenis lainnya yang diberikan atau didukung oleh TradingView. Baca selengkapnya di Ketentuan Penggunaan.
Pernyataan Penyangkalan
Informasi dan publikasi ini tidak dimaksudkan, dan bukan merupakan, saran atau rekomendasi keuangan, investasi, trading, atau jenis lainnya yang diberikan atau didukung oleh TradingView. Baca selengkapnya di Ketentuan Penggunaan.