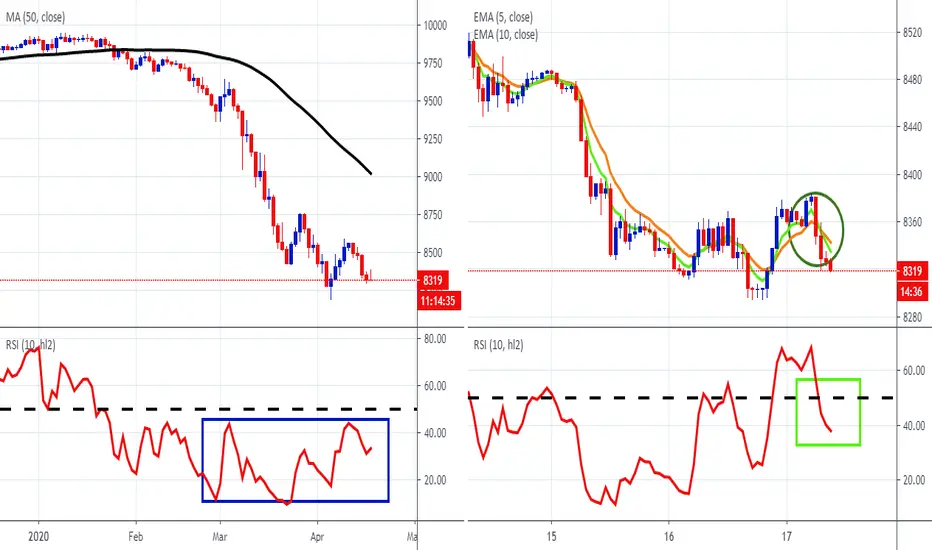
The left chart show's FXCM's emerging markets currency index, EMBASKET is black below its 50-day SMA. Moreover the SMA is pointing down with the RSI on the bearish side of 50 (blue rectangle). The right chart shows the hourly time frame. Here the green 5-hour EMA has crossed below the orange 10-hour EMA (green ellipse) and the RSI has moved below 50 (bright green rectangle). These are bearish developments and if the EMAs develop further angle and separation, the index will be showing further weak

Follow and Trade this analysis from your Charts. FXCM now Integrated with TradingView. Contact FXCM for more information.
Pernyataan Penyangkalan
Informasi dan publikasi ini tidak dimaksudkan, dan bukan merupakan, saran atau rekomendasi keuangan, investasi, trading, atau jenis lainnya yang diberikan atau didukung oleh TradingView. Baca selengkapnya di Ketentuan Penggunaan.
Pernyataan Penyangkalan
Informasi dan publikasi ini tidak dimaksudkan, dan bukan merupakan, saran atau rekomendasi keuangan, investasi, trading, atau jenis lainnya yang diberikan atau didukung oleh TradingView. Baca selengkapnya di Ketentuan Penggunaan.