Enigma Forming Double Bottom
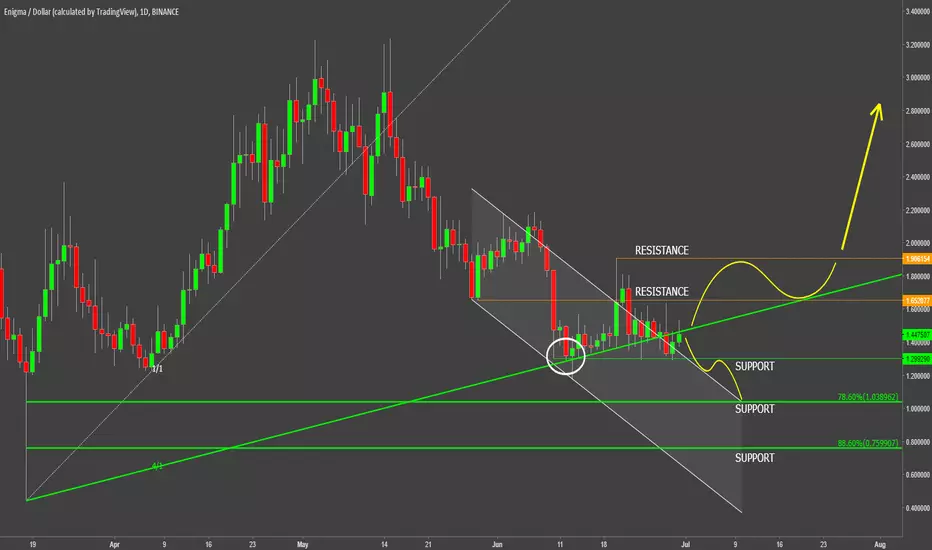
On the 13th of June Enigma found the bottom, hitting the low at $1.17 and rejecting the 4/1 Gann Fan trendline. On a daily chart price seem to have formed strong support at $1.3, that has been rejected multiple times, and closing price always stayed above.
Yesterday ENG/USD once again has tested this support level, and once again failed to break below. At this stage range trading could take place, as ENG also failed to break above the descending channel. Consolidation could take place between $1.3 and $1.9 levels, but only break and close above or below could shed some light on further direction.
If someone is looking for a buying opportunity, perhaps it is reasonable to wait for a $2 breakout, that should potentially trigger a rally. Prior to that, price will either consolidate or go down to 78.6% Fibs, that $1, a very strong psychological support.
Yesterday ENG/USD once again has tested this support level, and once again failed to break below. At this stage range trading could take place, as ENG also failed to break above the descending channel. Consolidation could take place between $1.3 and $1.9 levels, but only break and close above or below could shed some light on further direction.
If someone is looking for a buying opportunity, perhaps it is reasonable to wait for a $2 breakout, that should potentially trigger a rally. Prior to that, price will either consolidate or go down to 78.6% Fibs, that $1, a very strong psychological support.

Pernyataan Penyangkalan
Informasi dan publikasi ini tidak dimaksudkan, dan bukan merupakan, saran atau rekomendasi keuangan, investasi, trading, atau jenis lainnya yang diberikan atau didukung oleh TradingView. Baca selengkapnya di Ketentuan Penggunaan.
Pernyataan Penyangkalan
Informasi dan publikasi ini tidak dimaksudkan, dan bukan merupakan, saran atau rekomendasi keuangan, investasi, trading, atau jenis lainnya yang diberikan atau didukung oleh TradingView. Baca selengkapnya di Ketentuan Penggunaan.