Penjualan
ARSHAM- EOSUSDT DAILY CHART
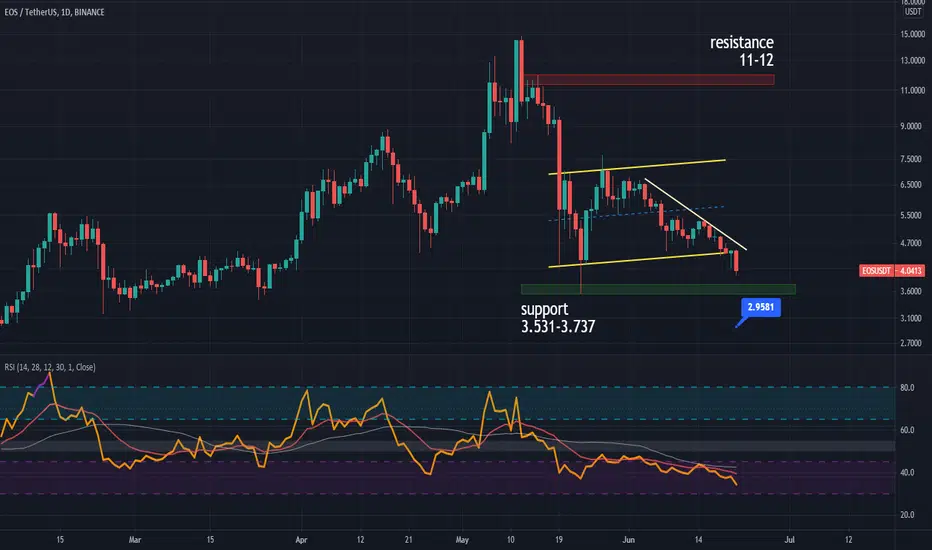
EOS was on a channel but it reached the end of the channel and was not supported there and now it has been able to break the bottom of the channel as well.
and we have support area at 3.531$.
if it is supported there it will try to break the resistance of the channel floor again and enter the channel again but if EOS is not supported t will see 2.95$ and also in the chart when we used RSI we did not see any divergence in it
please share youre idea in comment
and follow me
dont forget like
and we have support area at 3.531$.
if it is supported there it will try to break the resistance of the channel floor again and enter the channel again but if EOS is not supported t will see 2.95$ and also in the chart when we used RSI we did not see any divergence in it
please share youre idea in comment
and follow me
dont forget like

Pernyataan Penyangkalan
Informasi dan publikasi ini tidak dimaksudkan, dan bukan merupakan, saran atau rekomendasi keuangan, investasi, trading, atau jenis lainnya yang diberikan atau didukung oleh TradingView. Baca selengkapnya di Ketentuan Penggunaan.
Pernyataan Penyangkalan
Informasi dan publikasi ini tidak dimaksudkan, dan bukan merupakan, saran atau rekomendasi keuangan, investasi, trading, atau jenis lainnya yang diberikan atau didukung oleh TradingView. Baca selengkapnya di Ketentuan Penggunaan.