
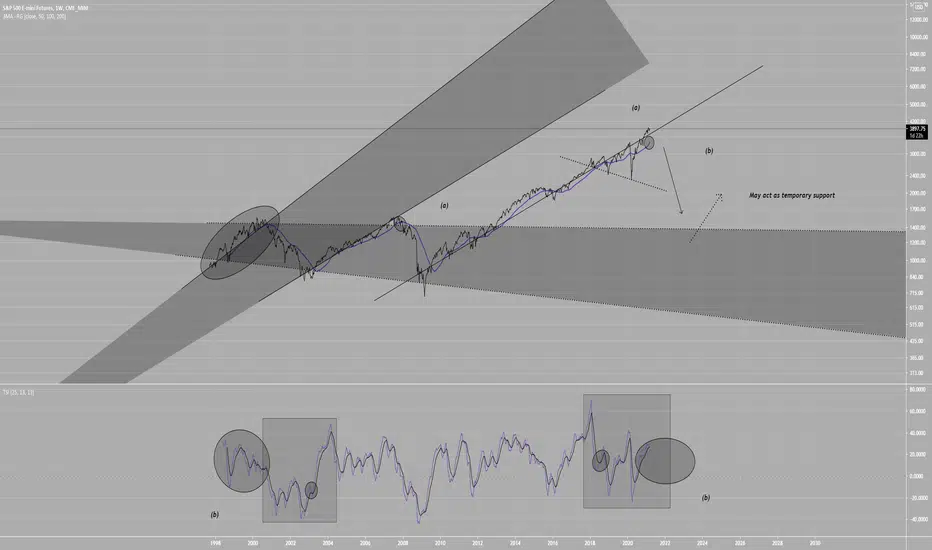
(a) is the 50MA, it can be seen to be curling upwards
and the comparison point (a) shows this ends in a bearish outcome
(b) is a similar points on TSI where I expect a reoccurrence of the pattern in oval to occur, likely acting bearishly.
As i have said before, assess the situation based on impact
2008 banking crisis the market collapsed
2020 COVID? Upward movement seems unjustified.
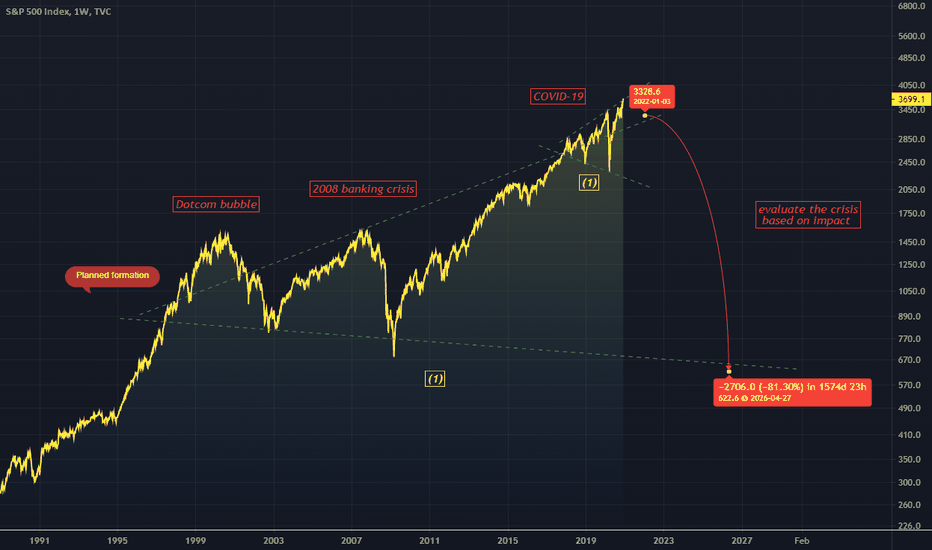
Here is a chart that further explains that philosophy.
I know the charts are kinda similar but I wanted to restate this for those unaware..
and the comparison point (a) shows this ends in a bearish outcome
(b) is a similar points on TSI where I expect a reoccurrence of the pattern in oval to occur, likely acting bearishly.
As i have said before, assess the situation based on impact
2008 banking crisis the market collapsed
2020 COVID? Upward movement seems unjustified.
Here is a chart that further explains that philosophy.
I know the charts are kinda similar but I wanted to restate this for those unaware..

Pernyataan Penyangkalan
Informasi dan publikasi ini tidak dimaksudkan, dan bukan merupakan, saran atau rekomendasi keuangan, investasi, trading, atau jenis lainnya yang diberikan atau didukung oleh TradingView. Baca selengkapnya di Ketentuan Penggunaan.
Pernyataan Penyangkalan
Informasi dan publikasi ini tidak dimaksudkan, dan bukan merupakan, saran atau rekomendasi keuangan, investasi, trading, atau jenis lainnya yang diberikan atau didukung oleh TradingView. Baca selengkapnya di Ketentuan Penggunaan.