
Hello?
Hello traders!
If you "Follow" us, you can always get new information quickly.
Please also click “Boost”.
Have a good day.
-------------------------------------
(ETCUSDT chart)

The key is whether the price can be maintained by receiving support around 11.338-16.07 and rising above 19.45.
(1D chart)


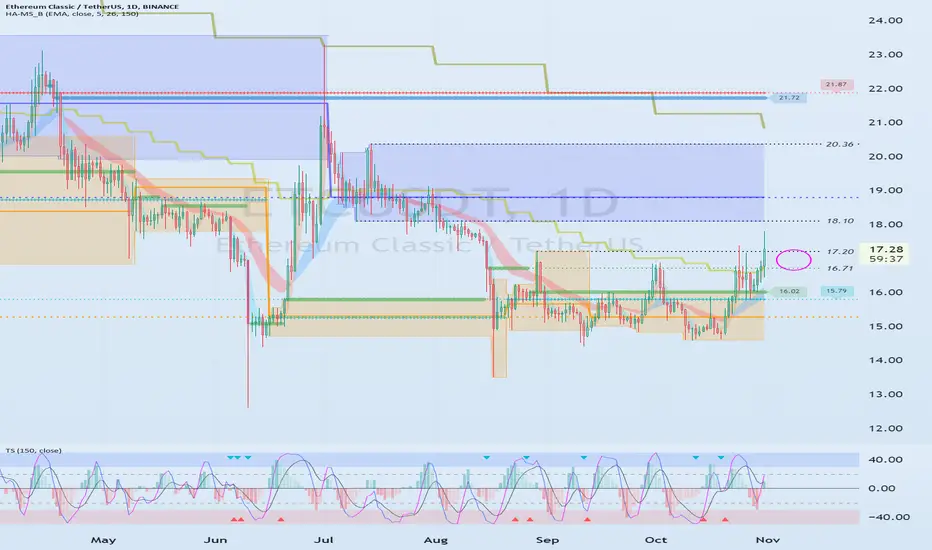
We need to see if it can receive support around 16.71-17.20 and rise above 18.80.
If it falls below 15.27, caution is needed as there is a possibility of a new low.
--------------------------------------------------
- The big picture

The full-fledged upward trend is expected to begin when the price rises above 29K.
This is the section expected to be touched in the next bull market, 81K-95K.
-------------------------------------------------- -------------------------------------------
** All explanations are for reference only and do not guarantee profit or loss in investment.
** Trading volume is displayed as a candle body based on 10EMA.
How to display (in order from darkest to darkest)
More than 3 times the trading volume of 10EMA > 2.5 times > 2.0 times > 1.25 times > Trading volume below 10EMA
** Even if you know other people’s know-how, it takes a considerable amount of time to make it your own.
** This chart was created using my know-how.
---------------------------------
Hello traders!
If you "Follow" us, you can always get new information quickly.
Please also click “Boost”.
Have a good day.
-------------------------------------
(ETCUSDT chart)
The key is whether the price can be maintained by receiving support around 11.338-16.07 and rising above 19.45.
(1D chart)
We need to see if it can receive support around 16.71-17.20 and rise above 18.80.
If it falls below 15.27, caution is needed as there is a possibility of a new low.
--------------------------------------------------
- The big picture
The full-fledged upward trend is expected to begin when the price rises above 29K.
This is the section expected to be touched in the next bull market, 81K-95K.
-------------------------------------------------- -------------------------------------------
** All explanations are for reference only and do not guarantee profit or loss in investment.
** Trading volume is displayed as a candle body based on 10EMA.
How to display (in order from darkest to darkest)
More than 3 times the trading volume of 10EMA > 2.5 times > 2.0 times > 1.25 times > Trading volume below 10EMA
** Even if you know other people’s know-how, it takes a considerable amount of time to make it your own.
** This chart was created using my know-how.
---------------------------------

[Practical trading strategy using HA-MS and SBOD]
youtu.be/aceN1AttX1Y
[Telegram Channel]
t.me/readCryptoChannel
[Binance Futures Message Channel]
t.me/readcryptobns
[업비트 메시지 채널]
t.me/readcryptoubt
youtu.be/aceN1AttX1Y
[Telegram Channel]
t.me/readCryptoChannel
[Binance Futures Message Channel]
t.me/readcryptobns
[업비트 메시지 채널]
t.me/readcryptoubt
Publikasi terkait
Pernyataan Penyangkalan
Informasi dan publikasi ini tidak dimaksudkan, dan bukan merupakan, saran atau rekomendasi keuangan, investasi, trading, atau jenis lainnya yang diberikan atau didukung oleh TradingView. Baca selengkapnya di Ketentuan Penggunaan.
[Practical trading strategy using HA-MS and SBOD]
youtu.be/aceN1AttX1Y
[Telegram Channel]
t.me/readCryptoChannel
[Binance Futures Message Channel]
t.me/readcryptobns
[업비트 메시지 채널]
t.me/readcryptoubt
youtu.be/aceN1AttX1Y
[Telegram Channel]
t.me/readCryptoChannel
[Binance Futures Message Channel]
t.me/readcryptobns
[업비트 메시지 채널]
t.me/readcryptoubt
Publikasi terkait
Pernyataan Penyangkalan
Informasi dan publikasi ini tidak dimaksudkan, dan bukan merupakan, saran atau rekomendasi keuangan, investasi, trading, atau jenis lainnya yang diberikan atau didukung oleh TradingView. Baca selengkapnya di Ketentuan Penggunaan.