
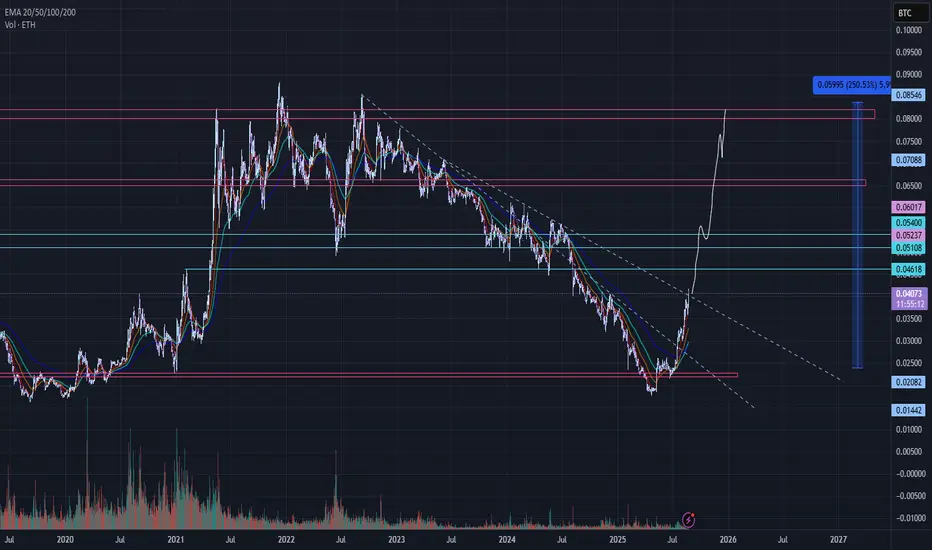
ETH pressing into ATH zone for the first time in 5 years
ETHBTC chart shows the possibility of a significant move against BTC by the end of the year.
Fundamental Adoption has spiked massively with ETF inflows matching BTC volumes, with eths market cap orders of magnitude smaller...
This translates to a potential and probable explosive move upwards potentially towards 10kusd zone on the USD chart.
That would look something like this on the BTC chart and seasonality suggests only 4months for this move to take place...
bullish times.

Publikasi terkait
Pernyataan Penyangkalan
Informasi dan publikasi ini tidak dimaksudkan, dan bukan merupakan, saran atau rekomendasi keuangan, investasi, trading, atau jenis lainnya yang diberikan atau didukung oleh TradingView. Baca selengkapnya di Ketentuan Penggunaan.
Publikasi terkait
Pernyataan Penyangkalan
Informasi dan publikasi ini tidak dimaksudkan, dan bukan merupakan, saran atau rekomendasi keuangan, investasi, trading, atau jenis lainnya yang diberikan atau didukung oleh TradingView. Baca selengkapnya di Ketentuan Penggunaan.