
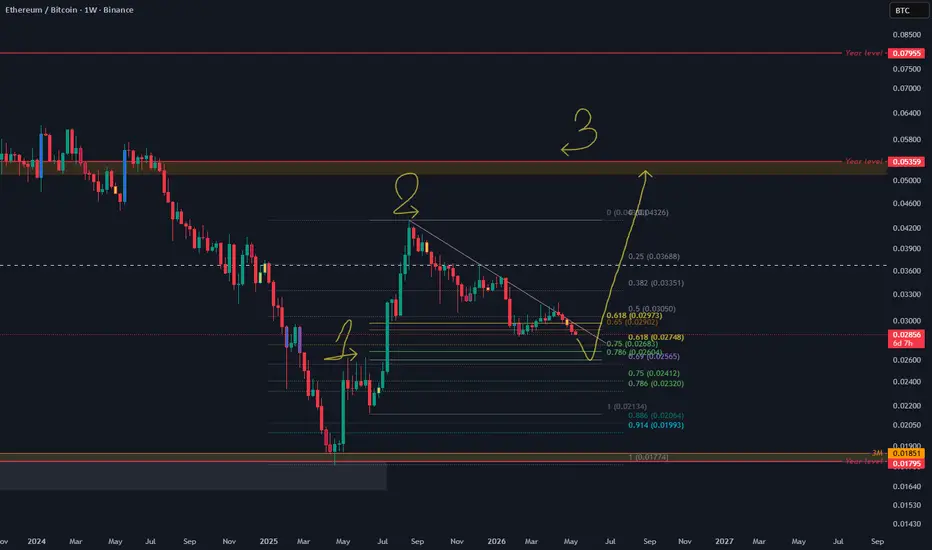
We’re deep in a multi-month corrective phase after the big 2024–2025 move. Price has been grinding inside a descending channel, respecting Fibonacci retracement levels perfectly.
Clear 3-wave corrective structure so far (labeled 1-2-3 on the chart)
Holding above the 0.786 Fib and the long-term yearly support zone (~0.028)
Multiple confluences pointing to a major turning point
I believe we’re in the final stages of this correction and preparing for Wave 3 — the strongest impulsive leg higher.
A clean breakout above the descending trendline and the 0.5–0.618 Fib zone (0.030–0.035) should trigger serious buying pressure on ETH and kick off the real Altseason we’ve all been waiting for.
Clear 3-wave corrective structure so far (labeled 1-2-3 on the chart)
Holding above the 0.786 Fib and the long-term yearly support zone (~0.028)
Multiple confluences pointing to a major turning point
I believe we’re in the final stages of this correction and preparing for Wave 3 — the strongest impulsive leg higher.
A clean breakout above the descending trendline and the 0.5–0.618 Fib zone (0.030–0.035) should trigger serious buying pressure on ETH and kick off the real Altseason we’ve all been waiting for.

Pernyataan Penyangkalan
Informasi dan publikasi ini tidak dimaksudkan, dan bukan merupakan, saran atau rekomendasi keuangan, investasi, trading, atau jenis lainnya yang diberikan atau didukung oleh TradingView. Baca selengkapnya di Ketentuan Penggunaan.
Pernyataan Penyangkalan
Informasi dan publikasi ini tidak dimaksudkan, dan bukan merupakan, saran atau rekomendasi keuangan, investasi, trading, atau jenis lainnya yang diberikan atau didukung oleh TradingView. Baca selengkapnya di Ketentuan Penggunaan.