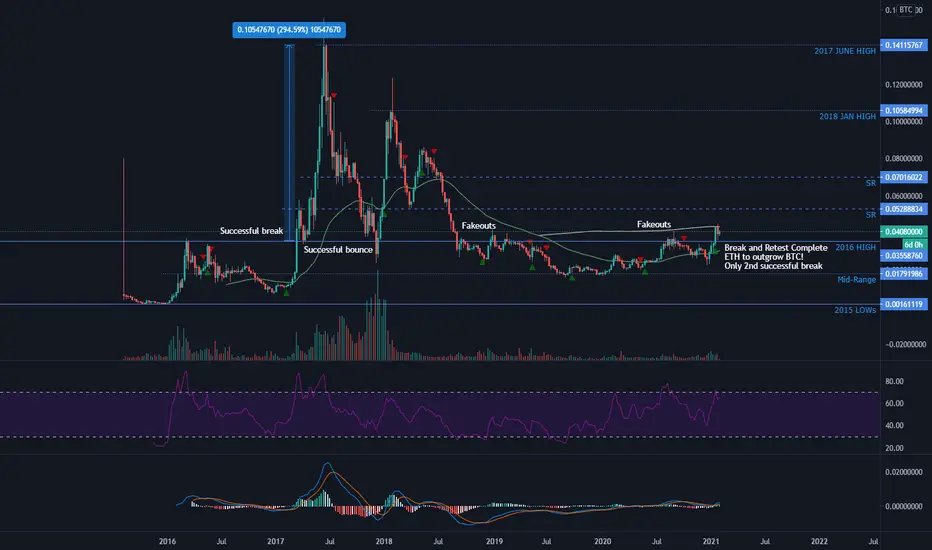
Here we have the 
 ETHBTC chart
Evident price has moved above the bottom range, and we have had a successful retest (red candle) - only the 2nd ever successful break
We have also had one successful bounce from the level
This means we should move upwards on this chart, especially if we can pass the 200MA and flip it to dynamic support
When this chart increases in value in means ETH is increasing in value against BTC, so if BTC stayed at 34K and this chart went to 0.07, ETH would be at 2.38K
Cmon the Ether...
ETHBTC chartEvident price has moved above the bottom range, and we have had a successful retest (red candle) - only the 2nd ever successful break
We have also had one successful bounce from the level
This means we should move upwards on this chart, especially if we can pass the 200MA and flip it to dynamic support
When this chart increases in value in means ETH is increasing in value against BTC, so if BTC stayed at 34K and this chart went to 0.07, ETH would be at 2.38K
Cmon the Ether...

Pernyataan Penyangkalan
Informasi dan publikasi ini tidak dimaksudkan, dan bukan merupakan, saran atau rekomendasi keuangan, investasi, trading, atau jenis lainnya yang diberikan atau didukung oleh TradingView. Baca selengkapnya di Ketentuan Penggunaan.
Pernyataan Penyangkalan
Informasi dan publikasi ini tidak dimaksudkan, dan bukan merupakan, saran atau rekomendasi keuangan, investasi, trading, atau jenis lainnya yang diberikan atau didukung oleh TradingView. Baca selengkapnya di Ketentuan Penggunaan.