
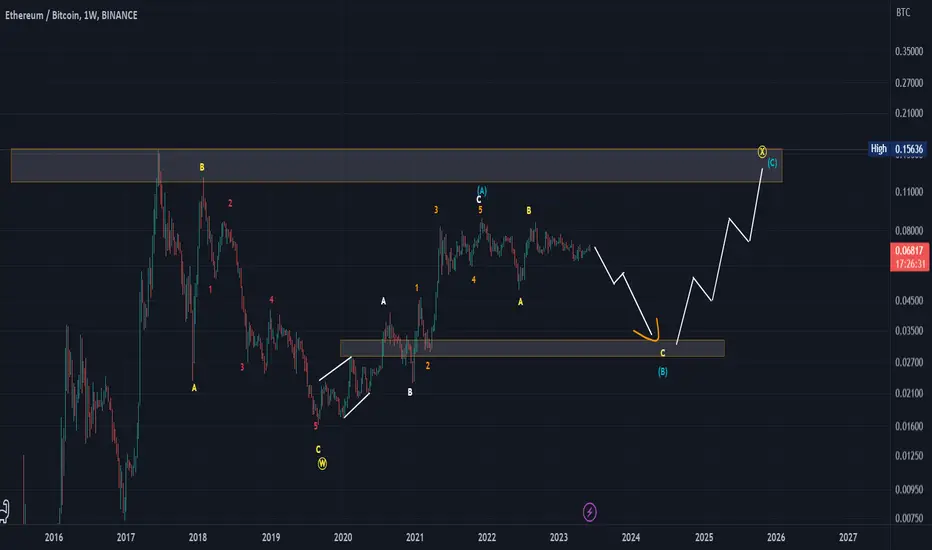
This is now the general direction of the Bitcoin Ether chart, and when it reaches the shaded area below, it will head again to test the historical top in the shaded area above.
Note: This is a weekly chart, which means it will take some time to fall to the shaded area below, and the average time to rise again to test the shaded area above.
If this chart and dozens of other successful analyzes on my page helped you, please like and comment
Note: This is a weekly chart, which means it will take some time to fall to the shaded area below, and the average time to rise again to test the shaded area above.
If this chart and dozens of other successful analyzes on my page helped you, please like and comment
Trade aktif
Trade aktif
Trade aktif
Trade aktif

Publikasi terkait
Pernyataan Penyangkalan
Informasi dan publikasi ini tidak dimaksudkan, dan bukan merupakan, saran atau rekomendasi keuangan, investasi, trading, atau jenis lainnya yang diberikan atau didukung oleh TradingView. Baca selengkapnya di Ketentuan Penggunaan.
Publikasi terkait
Pernyataan Penyangkalan
Informasi dan publikasi ini tidak dimaksudkan, dan bukan merupakan, saran atau rekomendasi keuangan, investasi, trading, atau jenis lainnya yang diberikan atau didukung oleh TradingView. Baca selengkapnya di Ketentuan Penggunaan.